All aircrafts naturally generate wake vortices as soon as there is lift. Wake vortices can be considered as two horizontal spiraling tubes trailing behind the aircraft and invisible to the human eyes. A trailing aircraft exposed to the wake vortices of a lead aircraft can experience an induced roll moment that is not easily corrected by the pilot or the autopilot.
The main objective of the SESAR 12.02.02 project[1–3] is to define, analyze and develop a verified wake vortex detection and prediction system according to the operational concept developed by P6.8.1 in order to, punctually or permanently reduce landing and departure wake turbulence separations and, therefore, to increase the runway throughput in such a way that it safely absorbs arrival demand peaks and/or reduces departure delays.
In Air Traffic Management (ATM), a key issue is to estimate the characteristic parameters of wake vortex, its strength and its position. The existing monitoring sensors for wake vortex include Radar and Lidar, and they are applicable for different weather conditions due to their different scattering mechanisms.
For the wake vortices detection, Lidar and Radar sensors are complementary in terms of ambient weather conditions[3]: X-band Radar performances are optimal under rainy conditions when Lidar performances are optimal in clear air.
The scattering of Lidar is mainly caused by the aerosols driven by the velocity of wake vortex[4]. Under rainy conditions, the scattering is mainly caused by the moving of droplets inside the wake.
Wake vortices danger is highly influenced by atmospheric conditions. In case of cross winds, wake vortices will be transported out of the way of the oncoming traffic and thus will not represent any more danger. In addition, wake vortices decay will be quicker with high atmospheric turbulence. Theoretical analyses show that decay time of wake vortices is proportional to the cubic root of Eddy Dissipation Rate (EDR).
During the last decade, a lot of studies have been performed to model the interaction between wake vortex and raindrops and a lot of algorithms have been proposed to retrieve the wake vortex parameters under rainy conditions (Refs. [5–7] for theoretical studies and Refs.[8–28] for empirical studies).
The purpose of this paper is to present the results obtained during the X-band RADAR wake vortex measurement campaign. It provides also an analysis of the meteorological situation and the wake vortex behavior gathered during the measurement campaign. In particular, a statistical analysis of the meteorological conditions is made and the rainy conditions in combination with RADAR measurements of wake vortices are analyzed.
The paper is organized as follows. The field instrumentation is presented in Section 2. The algorithm developed by THALES to detect the wake vortices under rainy conditions is presented in Section 3. In particular, the theoretical performances of the algorithm are presented. The data recorded in PARIS-CDG are analyzed in Section 4.
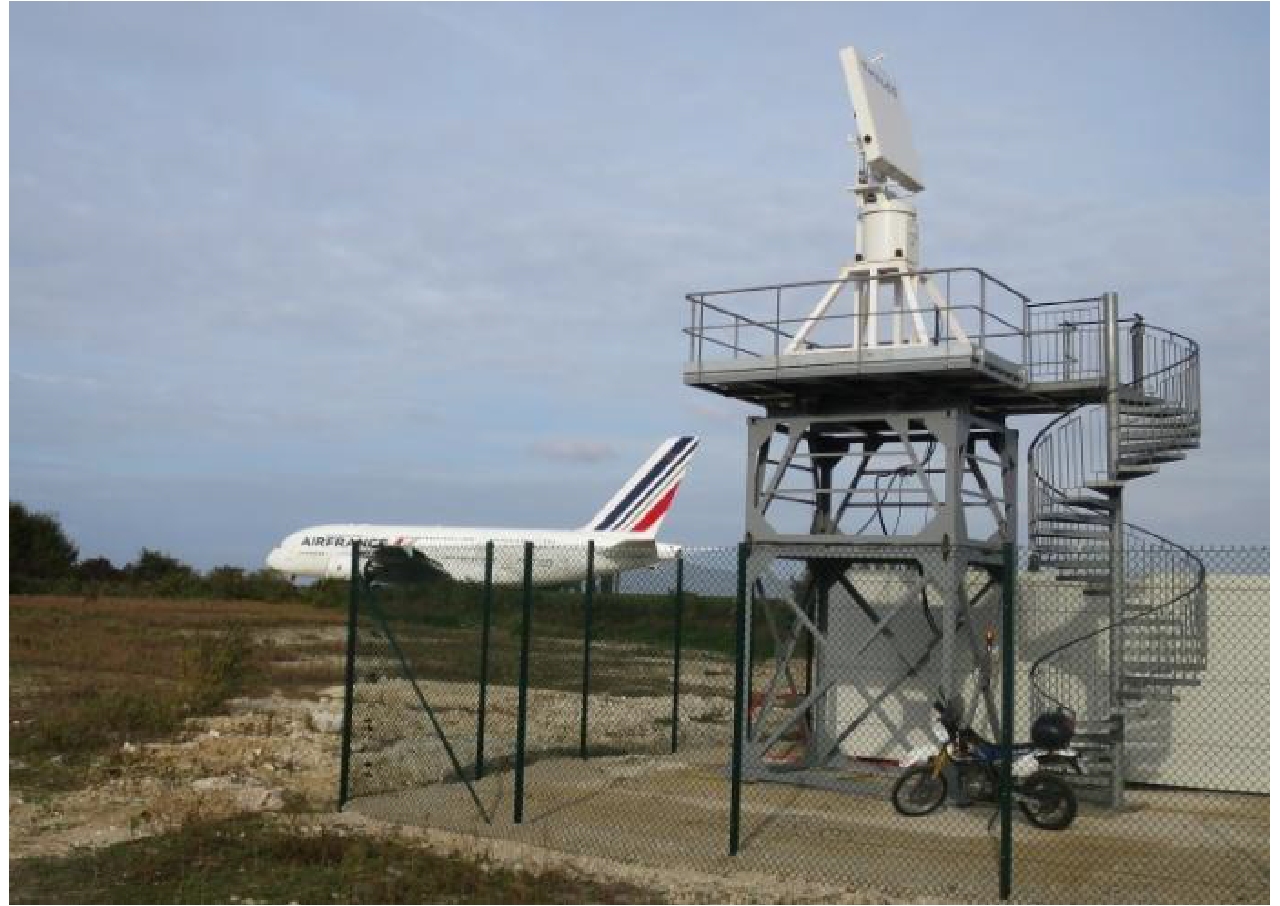
2 Field Instrumentation and Measuring Setup 2.1 THALES X-band radarThe THALES radar was deployed close to the 27R landing glide (see Fig. 1 and Fig. 2): its distance to the 27R glide is approximately 1100 meters and its distance to the 27L glide is approximately 700 m. Its distance, measured parallel to the glide, is 1420 m from the landing threshold 27R.
|
Fig.1 THALES X-band RADAR |

|
Fig.2 Location of THALES X-band RADAR |
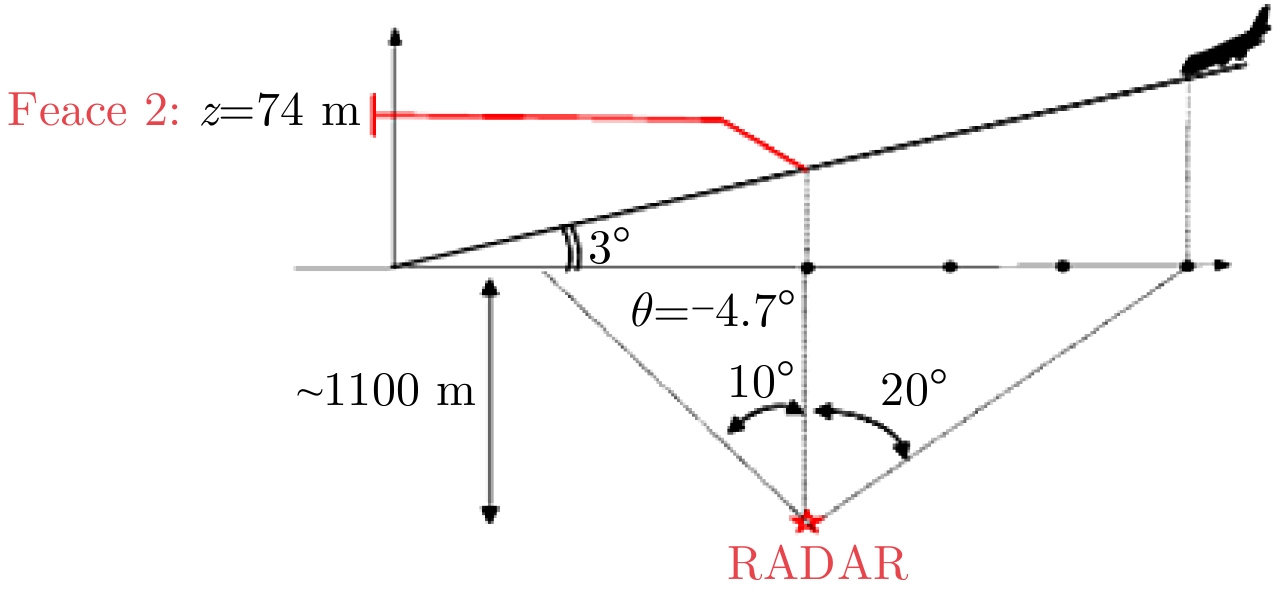
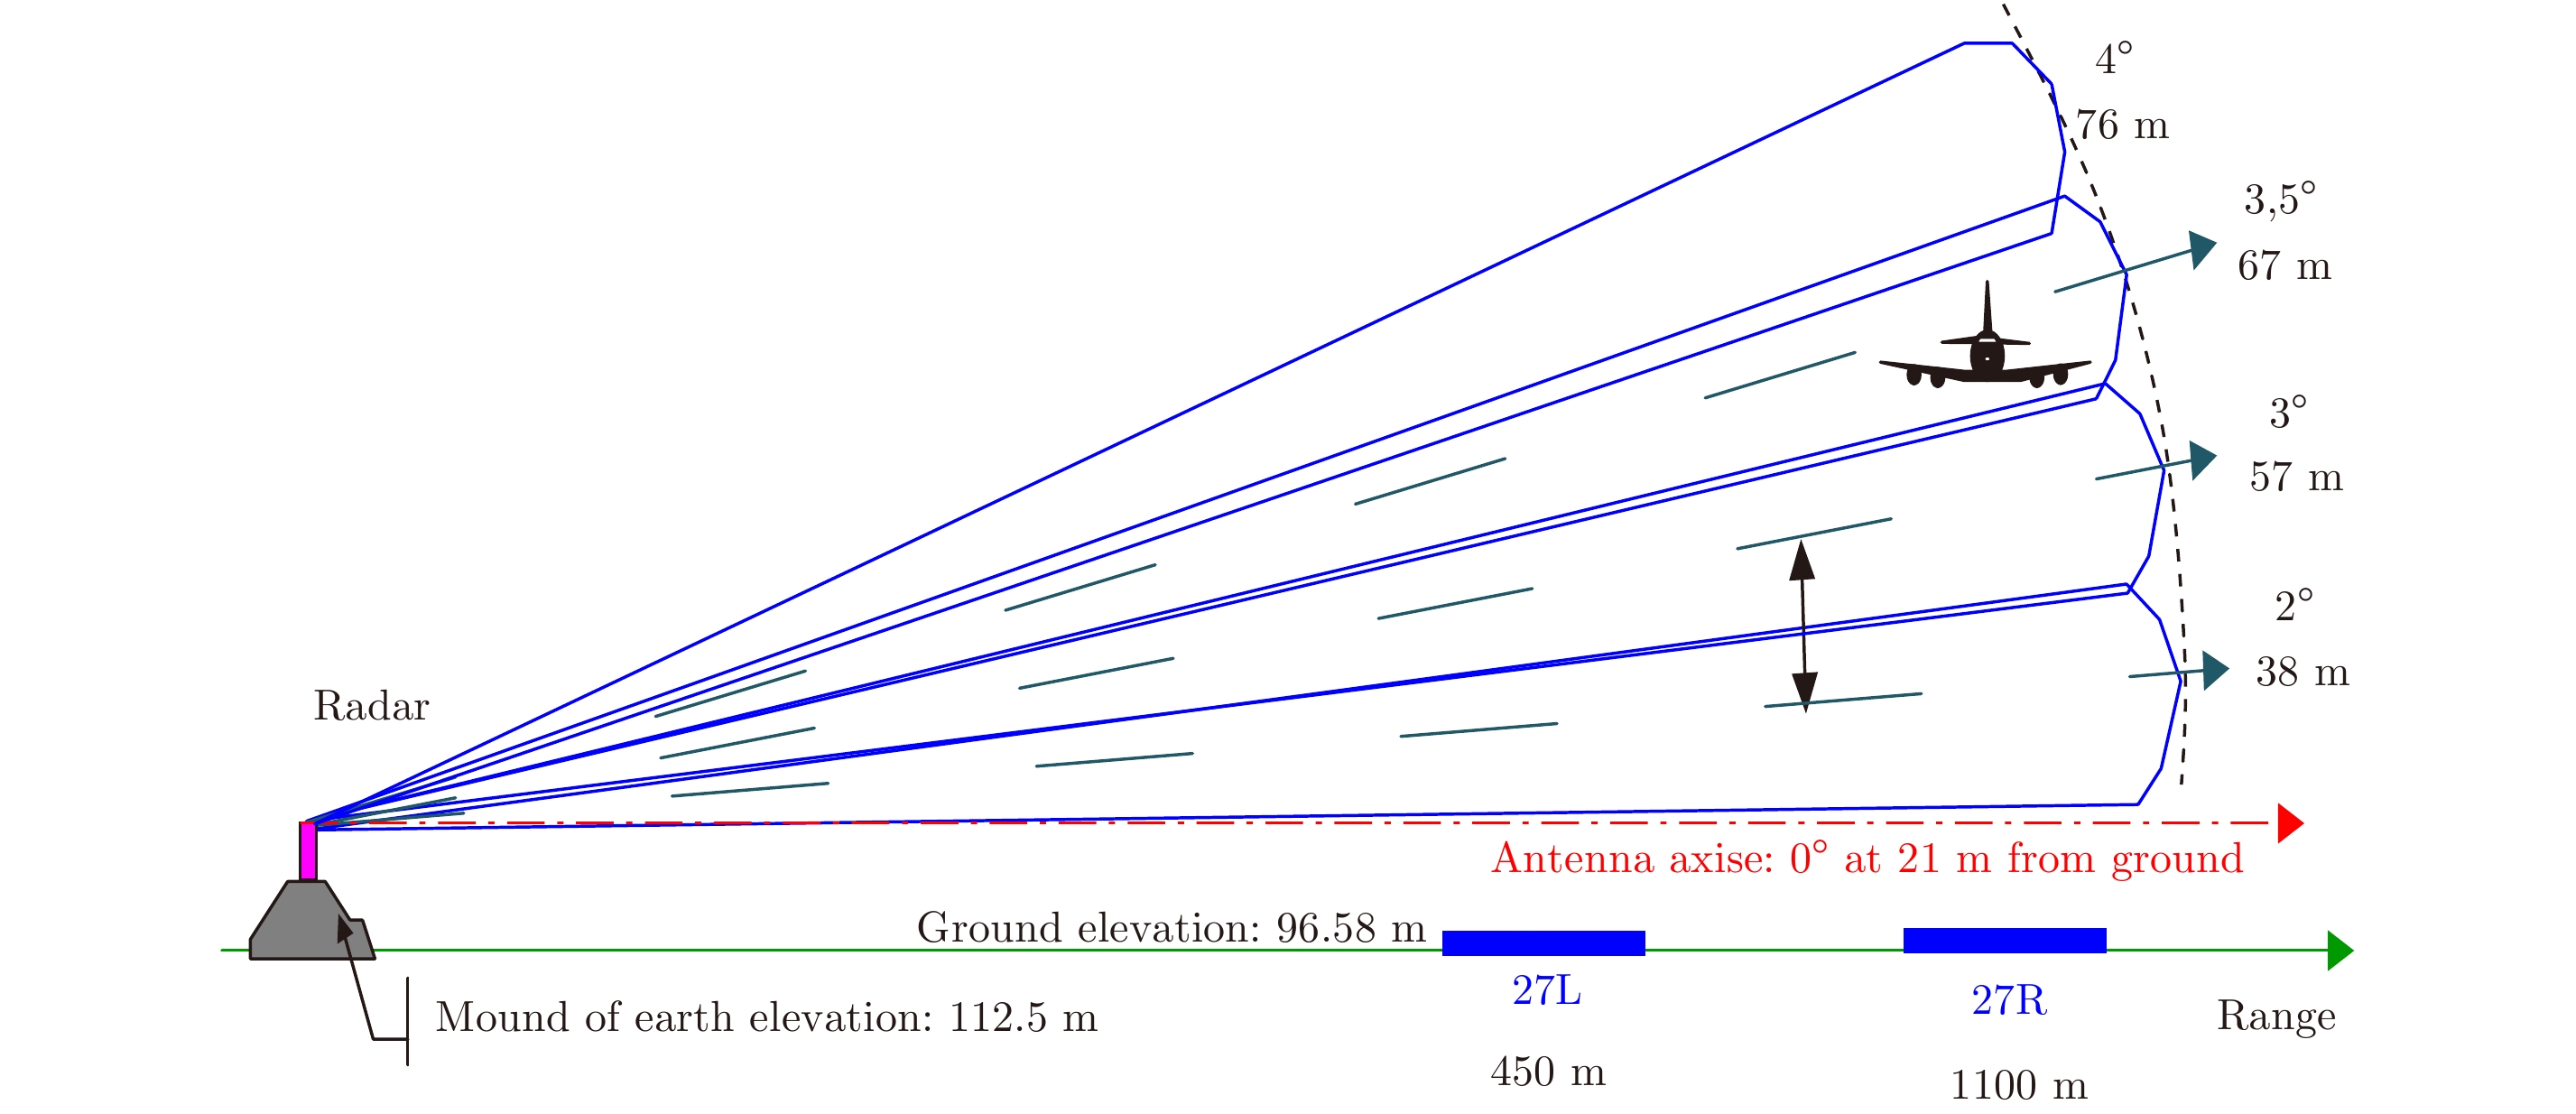
The horizontal scanning domain (see Fig. 3) is –10° to +20° around the normal to the glide and the vertical scanning domain (see Fig. 4) is 0° to 5° in elevation. The vertical domain is covered with four beams.
|
Fig.3 RADAR scanning domain (horizontal) |
|
Fig.4 RADAR scanning domain (vertical) |
The radar recorded data for vortices generated at expected altitudes around 67 m within the scanning domain. The data were post processed to generate wake plots, the update rate being 7.5 s. The update rate is equal to the antenna rotation rate.
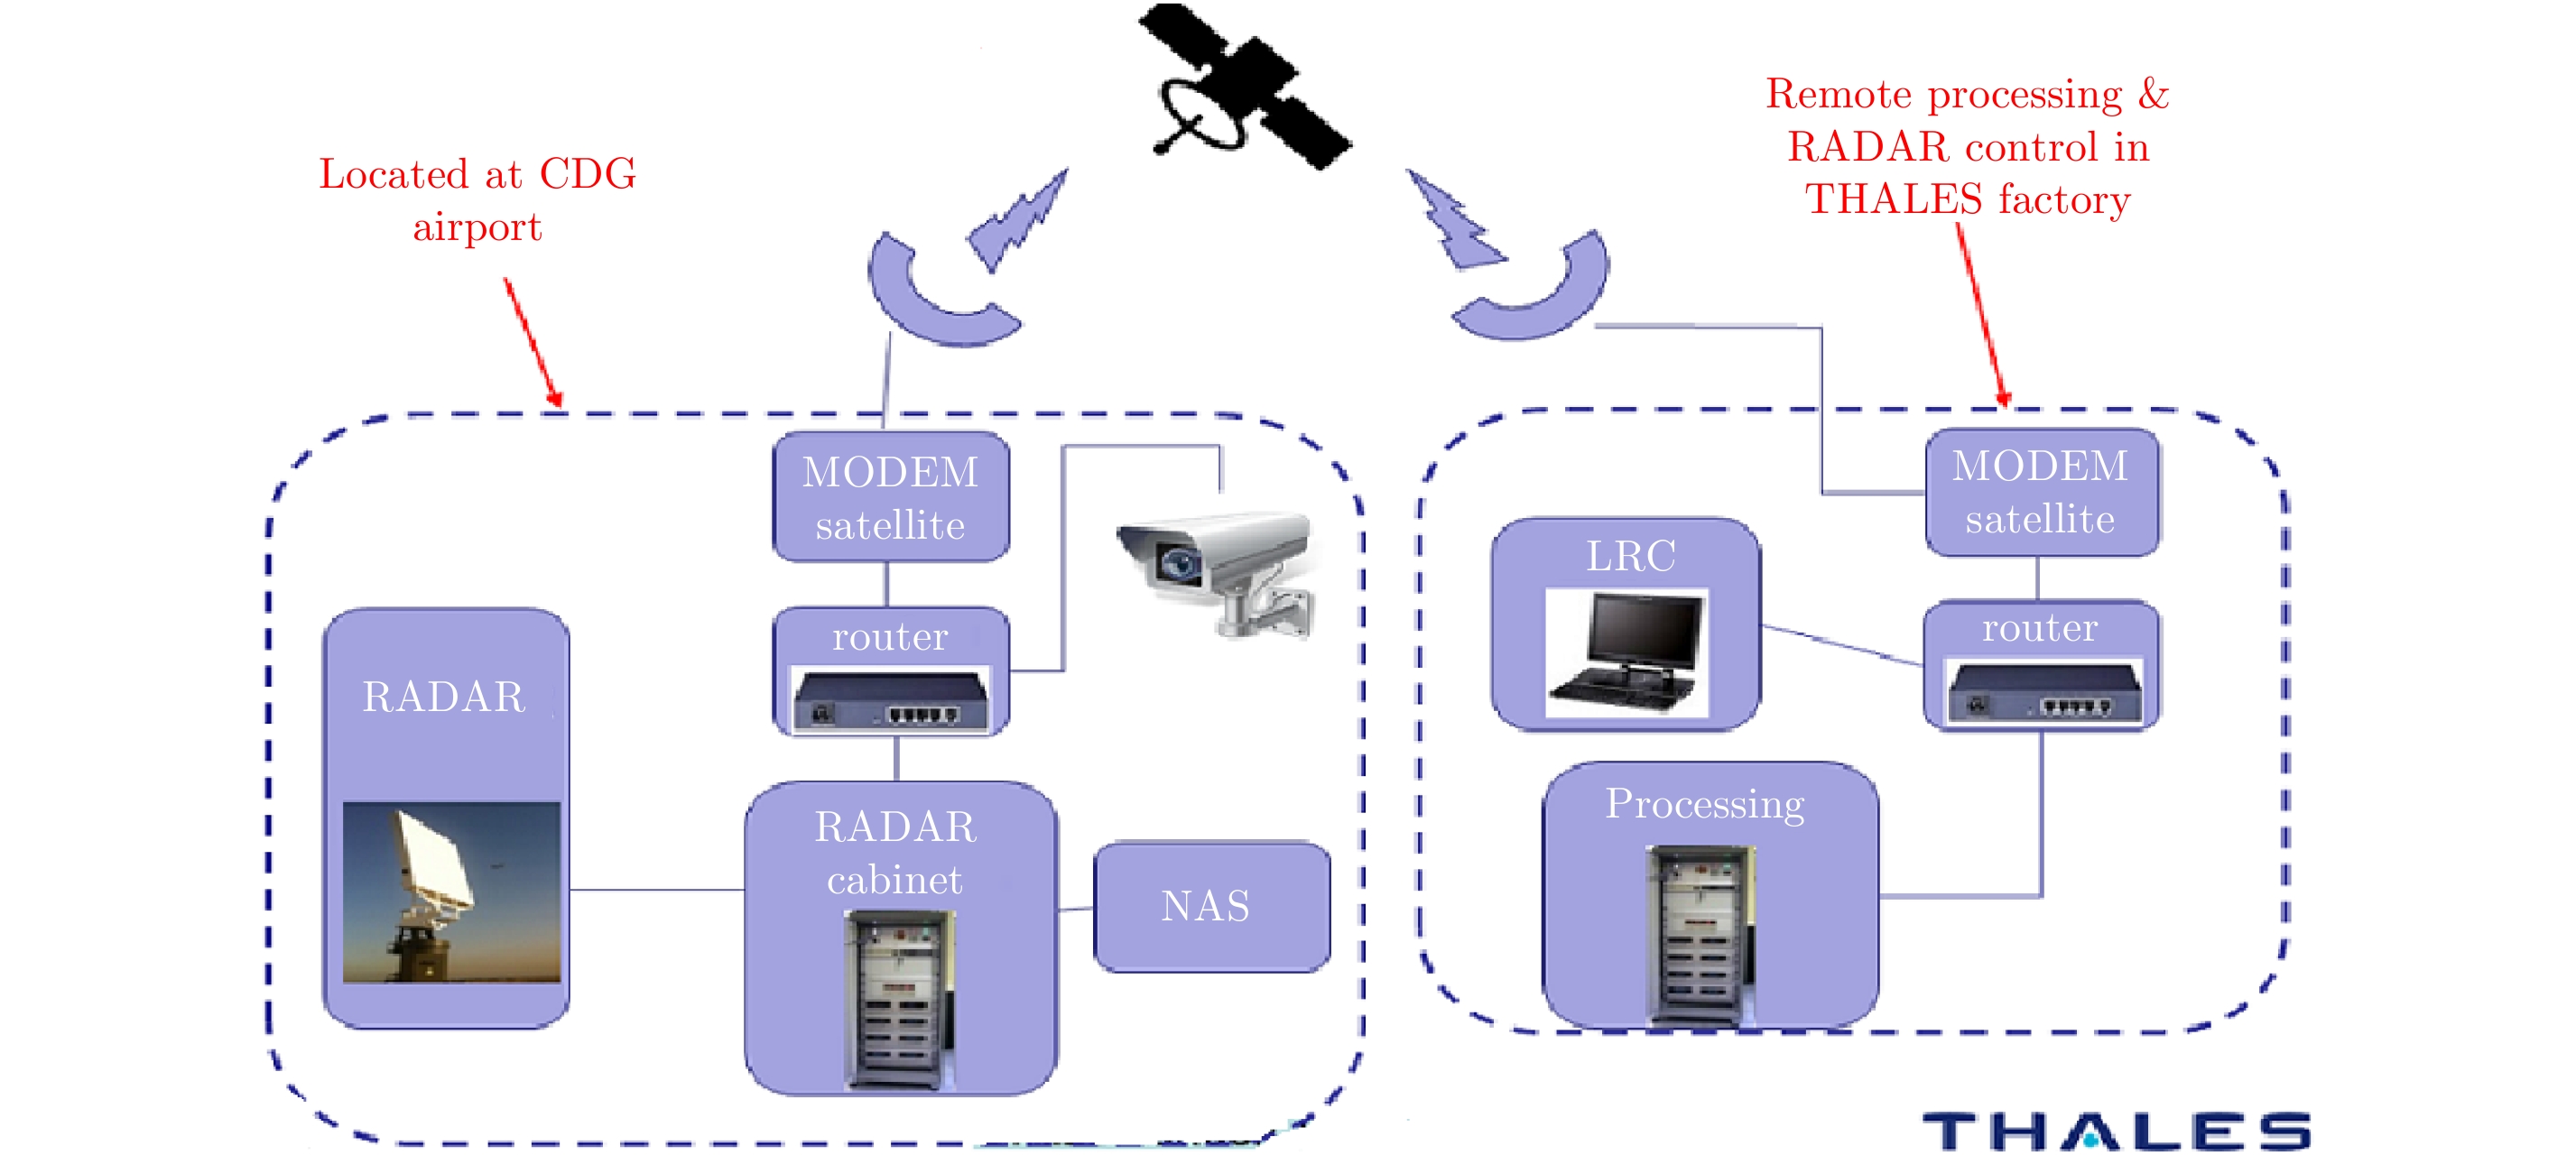
2.2 Network communication & RADAR data storageThe data collection campaign performed in PARIS-CDG was an opportunity to test tools (see Fig. 5) necessary to manage a RADAR sensor deployed on an airport in stand-alone mode for a long period (one year). A communication network, including a satellite link, was used to control remotely the RADAR sensor from THALES factory. A Local RADAR Control computer (LRC) located in THALES factory gave access to most of the parameters of the RADAR, like waveform parameters and transmit sectors. A camera system controlled the access to the RADAR area to ensure the security and the safety. The RADAR data were locally pre-processed and automatically recorded: Each time a landing aircraft crossed a pre-programmed area, the RADAR data were pre-processed and saved on a Network Attached Storage (NAS). When the RADAR was in “operational” mode, the pre-processed data were transferred to the THALES factory and processed in real time to extract the wake vortices parameters. The pre-processed data were also periodically stored on a mass storage memory to be processed off-line when tuning the wake vortices algorithms. An ADSB system is also connected to the network. It is used to record aircraft trajectories and to trig the RADAR data recorder.
|
Fig.5 Global architecture of RADAR system deployed in PARIS-CDG |
The Meteorological data are provided by METEO FRANCE. They are recorded with anemometers at position “Vent27” (see Fig. 2) close to the landing threshold 27R.
Anemometer data are stored in daily files grouped in a single directory for the whole period. Each file contains wind data from runways 09, 27, 08 and 26 with horizontal wind velocity and direction.
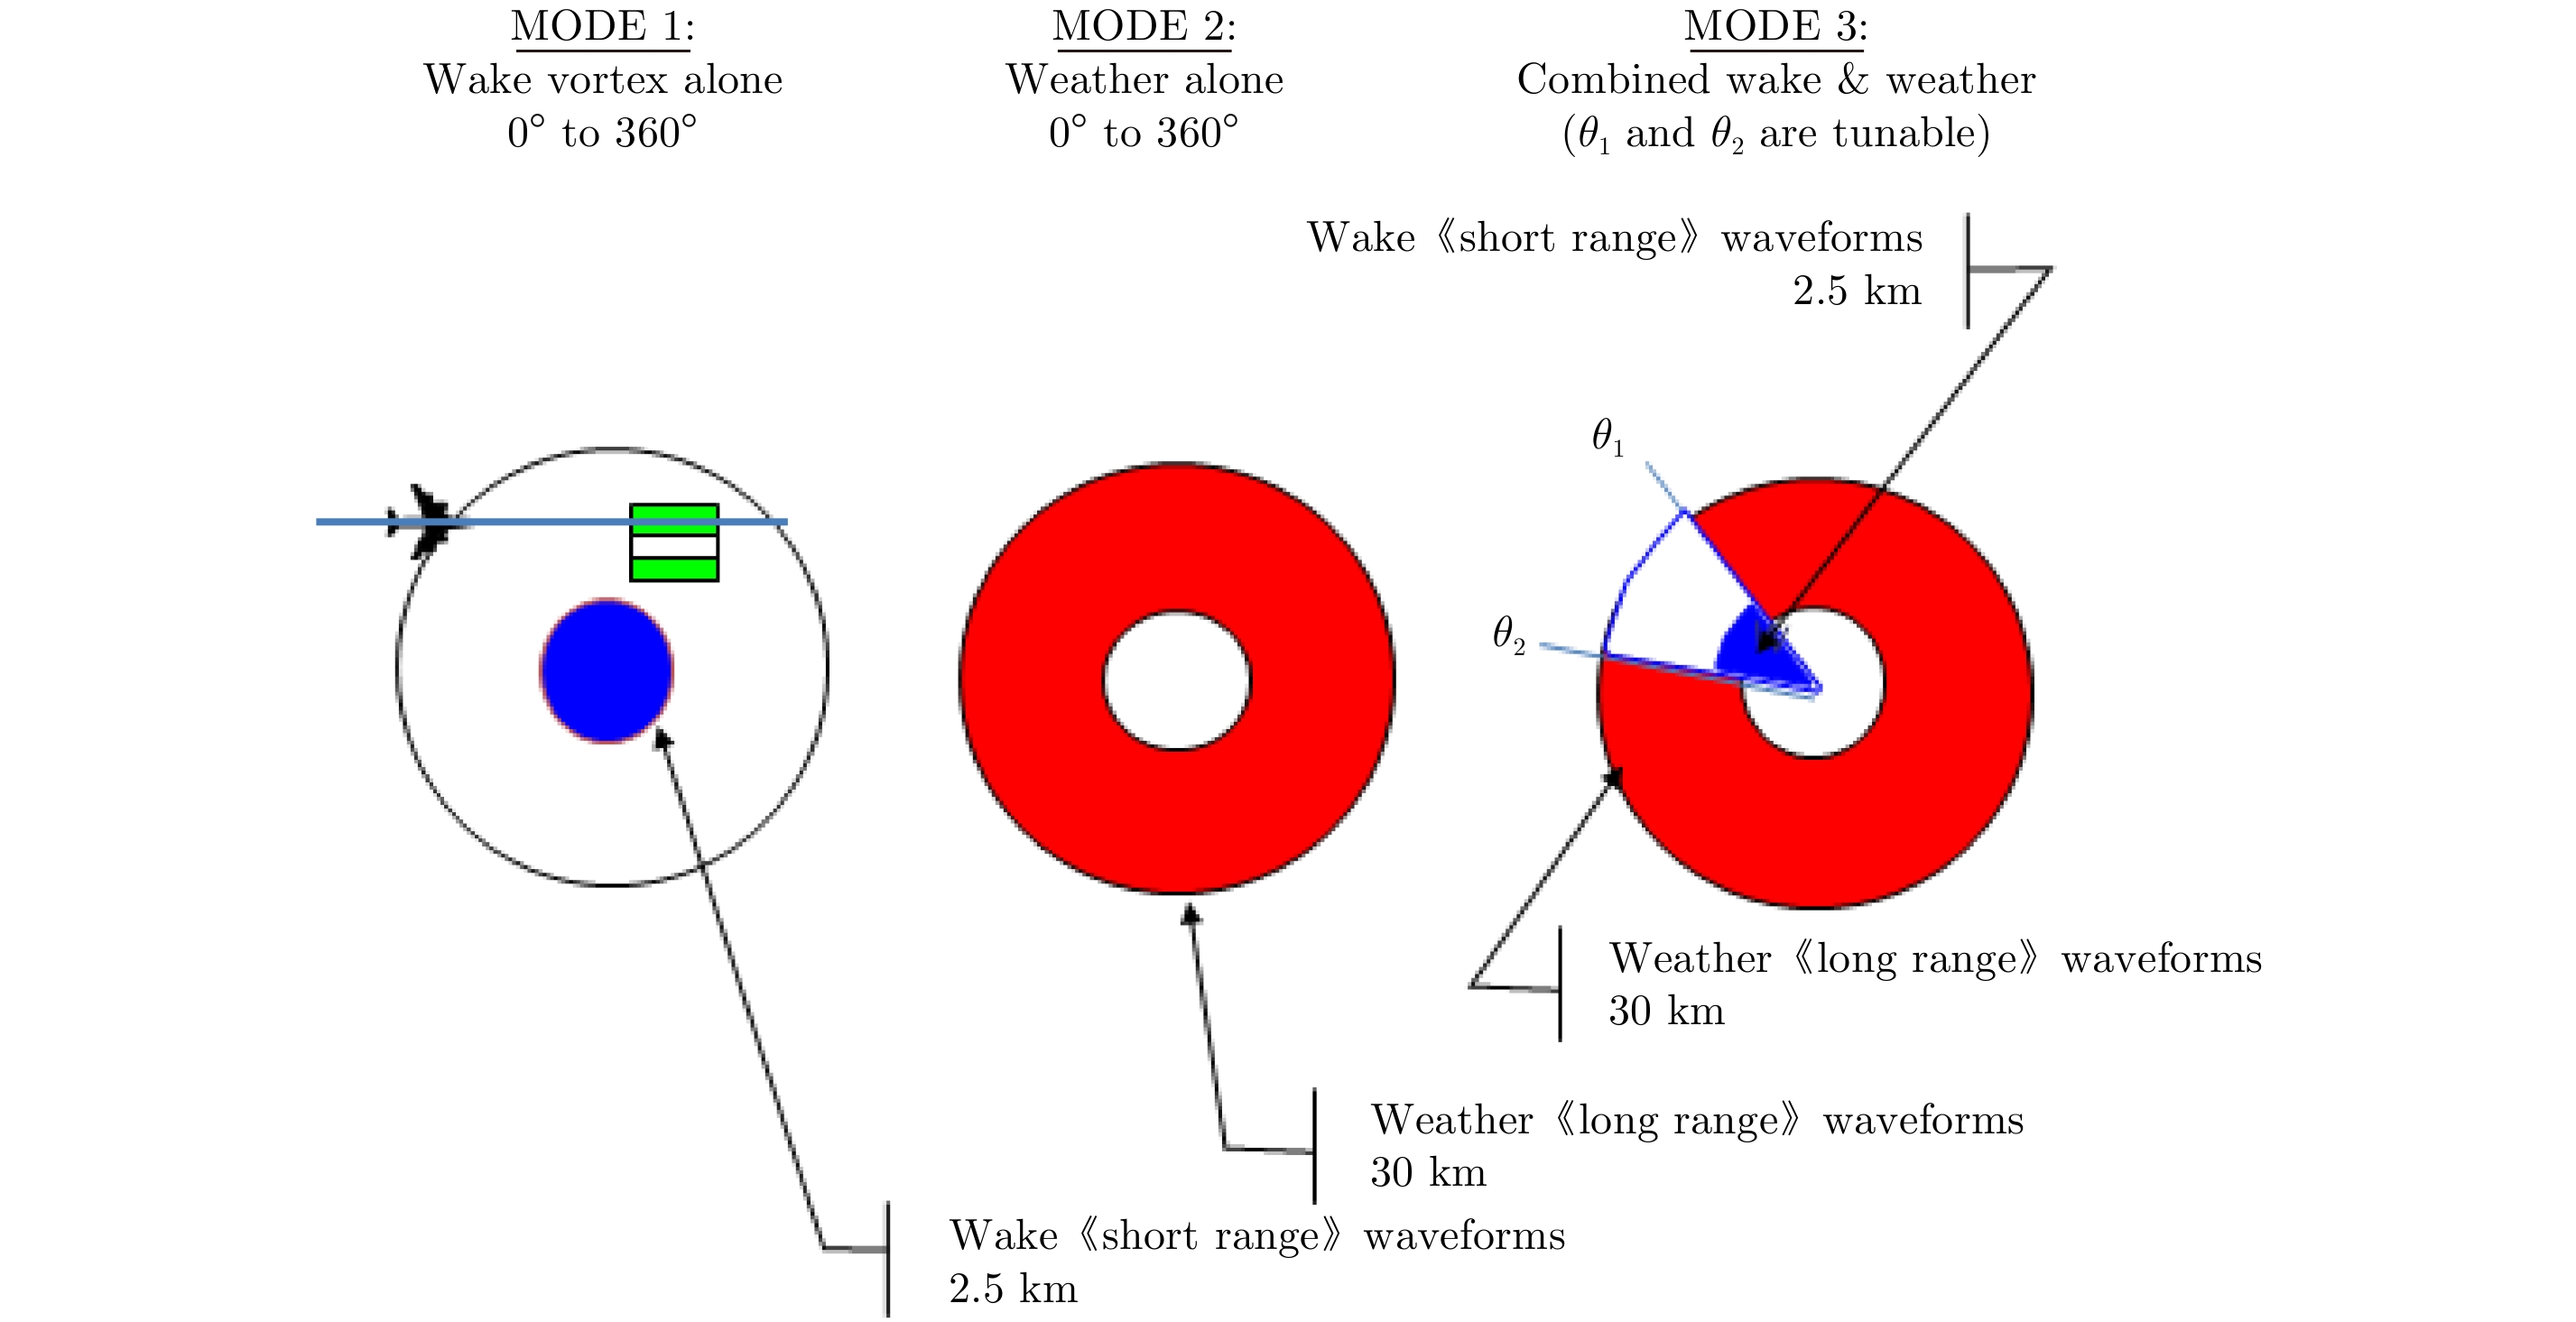
Another source of meteorological data is the X-band RADAR of THALES. The RADAR modes available during the data collection campaign are represented at Fig. 6. Most of the time, the mode 3 was used, combining wake vortices measurement and weather measurement:
|
Fig.6 X-band RADAR modes available |
• The domain of interest for wake vortices is
• Outside the wake vortices domain, specific waveforms are scheduled and the recorded I&Q should be processed in the range domain [2.5 km, 30 km] to obtain a 2D wind field around the glide and an estimation of rain rate based on SNR calculation.
3 Retrieval Algorithm 3.1 MethodologyThe document[3] provides recommendations on the type of sensors to be included in a system intended to detect vortices in all weather conditions. These recommendations are to deploy an X band RADAR and a 1.5 μm LIDAR both located perpendicularly to the runways, a few hundred meters upstream from the touch down area. Results in Ref. [3] show that RADAR and LIDAR are complementary depending on weather conditions: the X-band RADAR performances are optimal under rainy conditions while LIDAR performances are optimal in dry air.
This section aims to describe the principle of the algorithm developed for the RADAR sensor to retrieve the wake vortex parameters. The interaction between vortices and rain drops is analyzed in Refs. [4–28]. This PHD work shows that it is possible to retrieve the wake vortices parameters based on a RADAR signature analysis of rain droplets motion. The rain droplets motion reflects only partially the velocity field induced by wake vortices. This is due to the finite (and not null) weight of rain droplets. Consequently, the RADAR signature cannot be expressed into closed formulas depending on characteristics of wake vortices. Since it is not possible to express analytically the RADAR signature, THALES developed a simulator whose purpose is to find it empirically.
Formally, the simulator aims to provide an empirical function
| $\left[\!\! {\begin{array}{*{20}{c}}{{\upsilon _{\rm{D}}}}\\{{\sigma _{\rm{D}}}}\end{array}} \!\!\right] \!=\! \varPsi \left( {\left[\!\! {\begin{array}{*{20}{c}}{{\Gamma _{\rm{L}}}}\\{{x_{\rm{L}}}}\\{{y_{\rm{L}}}}\\{{z_{\rm{L}}}}\end{array}} \!\!\right],\;\left[\!\! {\begin{array}{*{20}{c}}{{\Gamma _{\rm{R}}}}\\{{x_{\rm{R}}}}\\{{y_{\rm{R}}}}\\{{z_{\rm{R}}}}\end{array}} \!\!\right],\;{b_0},\;\left[\!\! {\begin{array}{*{20}{c}}\theta \\\phi \\D\end{array}} \!\!\right],\;{V_{{\rm{rain}}, \ldots }}} \!\!\right)$ | (1) |
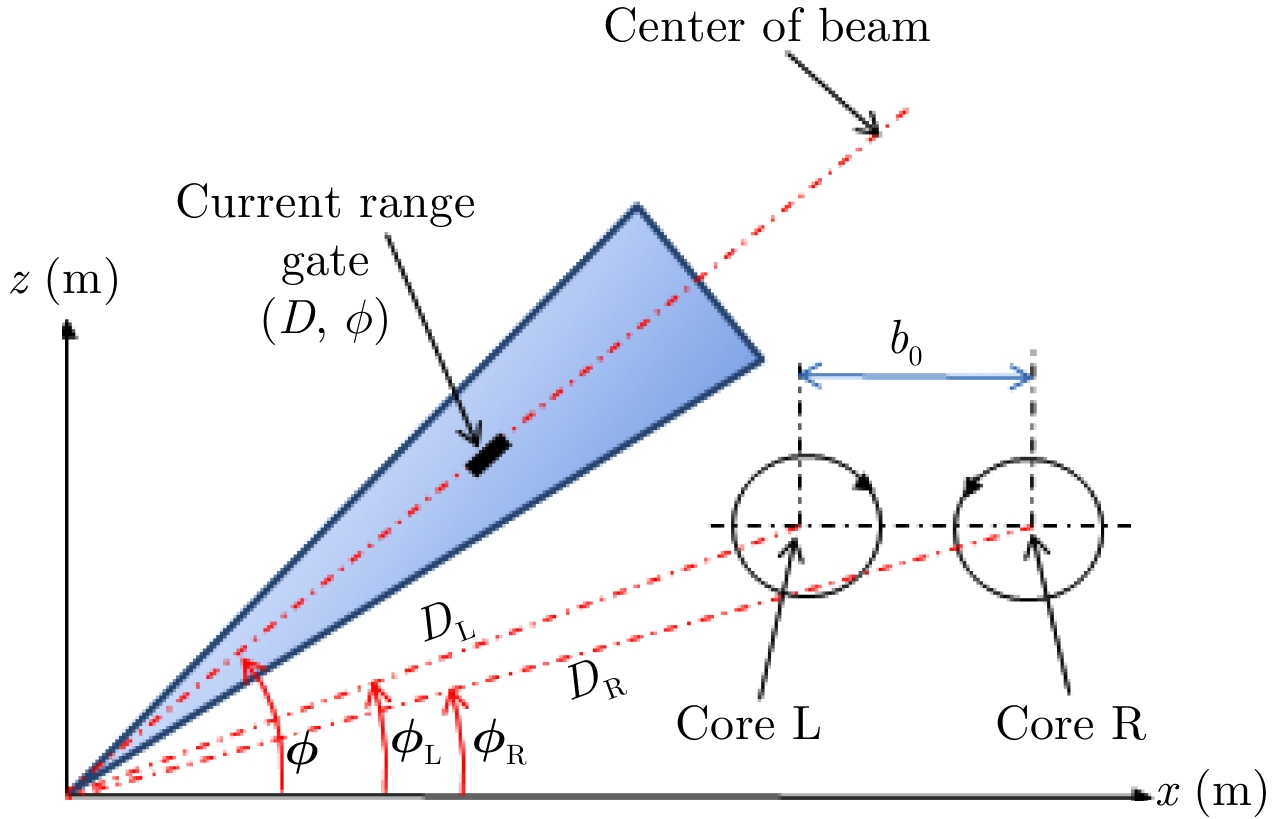
In this equation, the notations are (see Fig. 7):
|
Fig.7 Notations used to define a scenario |
•
•
•
• xL, yL, zL, xR, yR, zR: Cartesian coordinates of core counter rotational vortex (L=left and R=right).
• b0: distance between core L and R.
•
• D: current distance.
The methodology used to find the empirical function
A scenario is defined as a set of following parameters:
• An aircraft defined by its wing span, its landing weight and its landing speed.
• A rain rate in [1 mm/h, 5 mm/h, 20 mm/h].
• A wake vortex position defined by a distance to the RADAR in [930 m, 1180 m, 1430 m, 1680 m, 1930 m], an altitude (10 values ranging from 48 to 175 m).
• A beam position defined by an azimuth (normal to the glide) and an elevation in [2.0°, 3.5°, 4.0°, 5.0°, 6.5°].
The number of scenarios is 5×3×5×10×5=3750.
For each representative scenario, following calculations are performed:
• Step 1: generation of wind field due to clear air wake vortices.
• Step 2: generation of rain droplets (with different size depending on the rain rate) and calculation of their motion in vicinity of the vortices.
• Step 3: generation of the RADAR signature (Range/Doppler map).
• Step 4: Calculation of the 1st order moment (average velocity) and of the 2nd order moment (spectrum width).
The last step (step 5) consists to calculate the empirical
This section is to illustrate the application of the methodology described in Section 3.1 for an aircraft A319, an A300, an A350 and an A380.
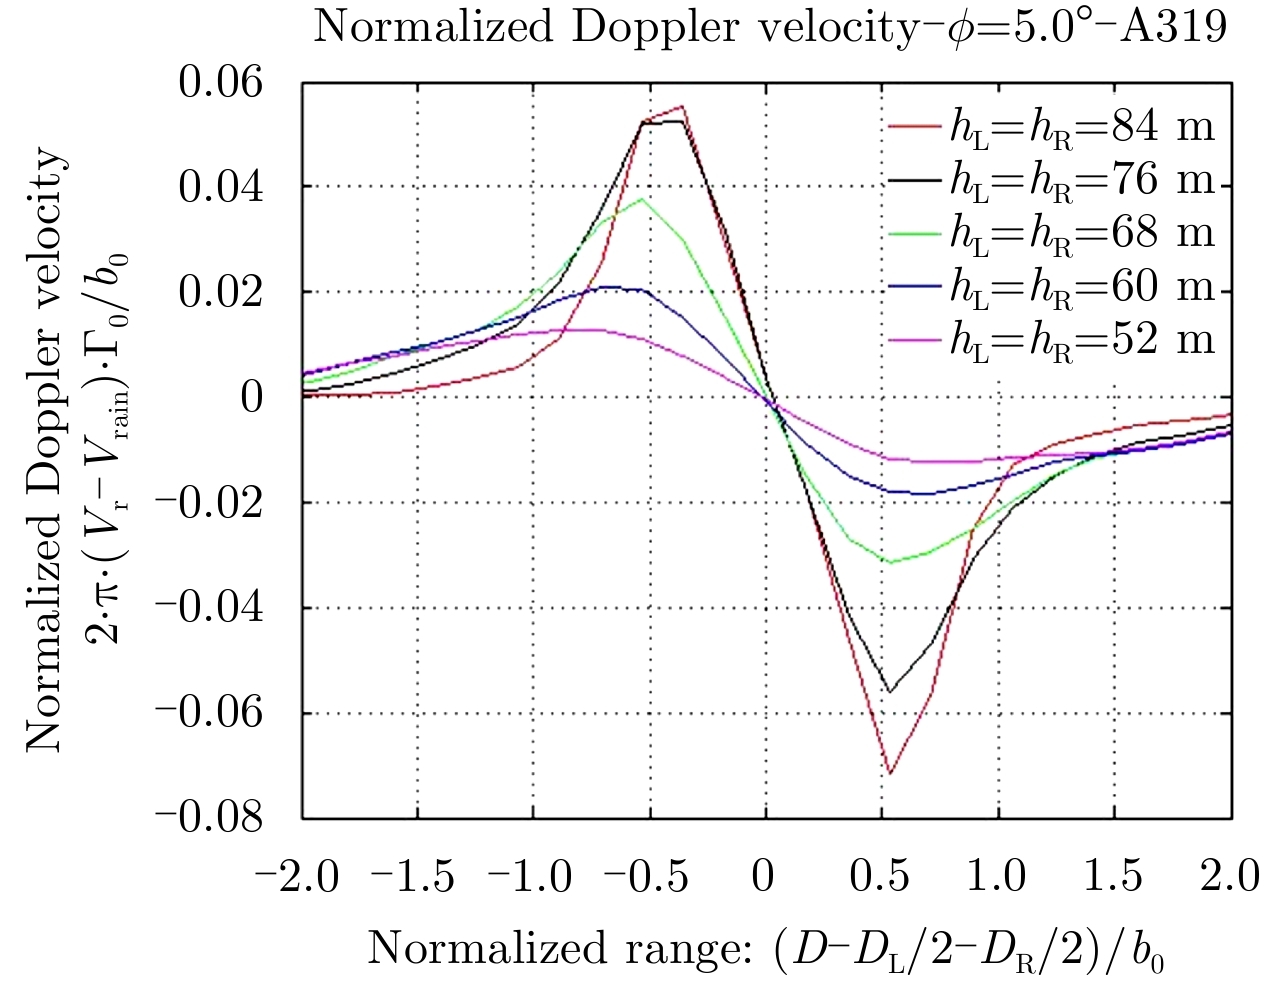
The Fig. 8 gives the calculated mean Doppler velocity as a function of range and altitude of vortices for an A319 when the beam elevation is constant (=5°) and when the middle range Dc of vortices is constant (=930 m).
|
Fig.8 Mean Doppler velocity as a function of range-Case of A319-Beam elevation 5° |
The same figures were generated for different beam elevations and different middle ranges Dc of vortices and different aircrafts (A300, A350 and A380)
Based on results of all scenarios defined in Section 3.1, following formula is used to fit the mean Doppler velocity, as a function of distance D and of beam elevation
| $\begin{align}{V_{\rm{r}}} = & {V_{{\rm{rain}}}} + \frac{{{\Gamma _L}}}{{2 \cdot {{π}} \cdot {b_0}}} \cdot {A_{\rm{L}}}\left( {\frac{{D - {D_{\rm{L}}}}}{{{b_0}}},\frac{{\phi - {\phi _{\rm{L}}}}}{{{\phi _{{\rm{beam}}}}}}} \right)\\&- \frac{{{\Gamma _{\rm{R}}}}}{{2 \cdot {{π}} \cdot {b_0}}} \cdot {A_{\rm{R}}}\left( {\frac{{D - {D_{\rm{R}}}}}{{{b_0}}},\frac{{\phi - {\phi _{\rm{R}}}}}{{{\phi _{{\rm{beam}}}}}}} \right)\end{align}$ | (2) |
In this equation:
• Vrain is the mean Doppler velocity due to rain alone (without vortices).
•
• b0 the distance between them, related to the wing span b:
| ${b_0} = \frac{{{π}}}{4} \cdot b$ | (3) |
• AL and AR are two fitting functions modeling the effect of counter rotational vortex on rain drops. The simulation results show that these functions depend on following normalized parameters (see Fig. 7 for notations):
| $\left. \begin{array}{l}\delta {D_{\rm{L}}}\!\!^* = \frac{{D - {D_{\rm{L}}}}}{{{b_0}}}\\\delta {\phi _{\rm{L}}}\!\!^* = \frac{{\phi - {\phi _{\rm{L}}}}}{{{\phi _{{\rm{beam}}}}}}\\\delta {D_{\rm{R}}}\!\!^* = \frac{{D - {D_{\rm{R}}}}}{{{b_0}}}\\\delta {\phi _{\rm{R}}}\!\!^* = \frac{{\phi - {\phi _{\rm{R}}}}}{{{\phi _{{\rm{beam}}}}}}\end{array} \right\}$ | (4) |
In these equations,
When the beam elevation
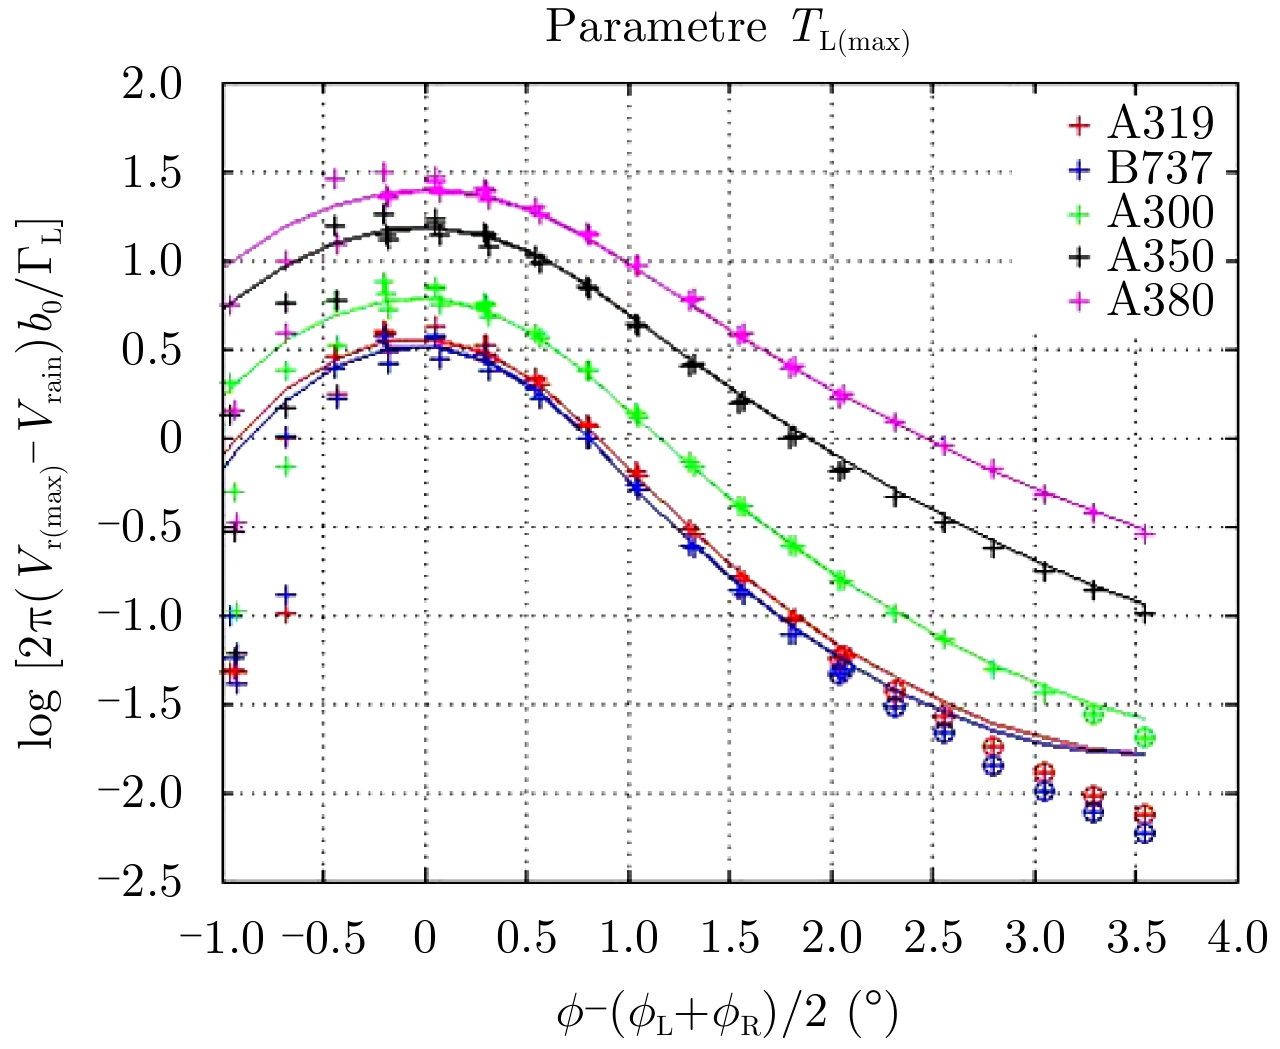
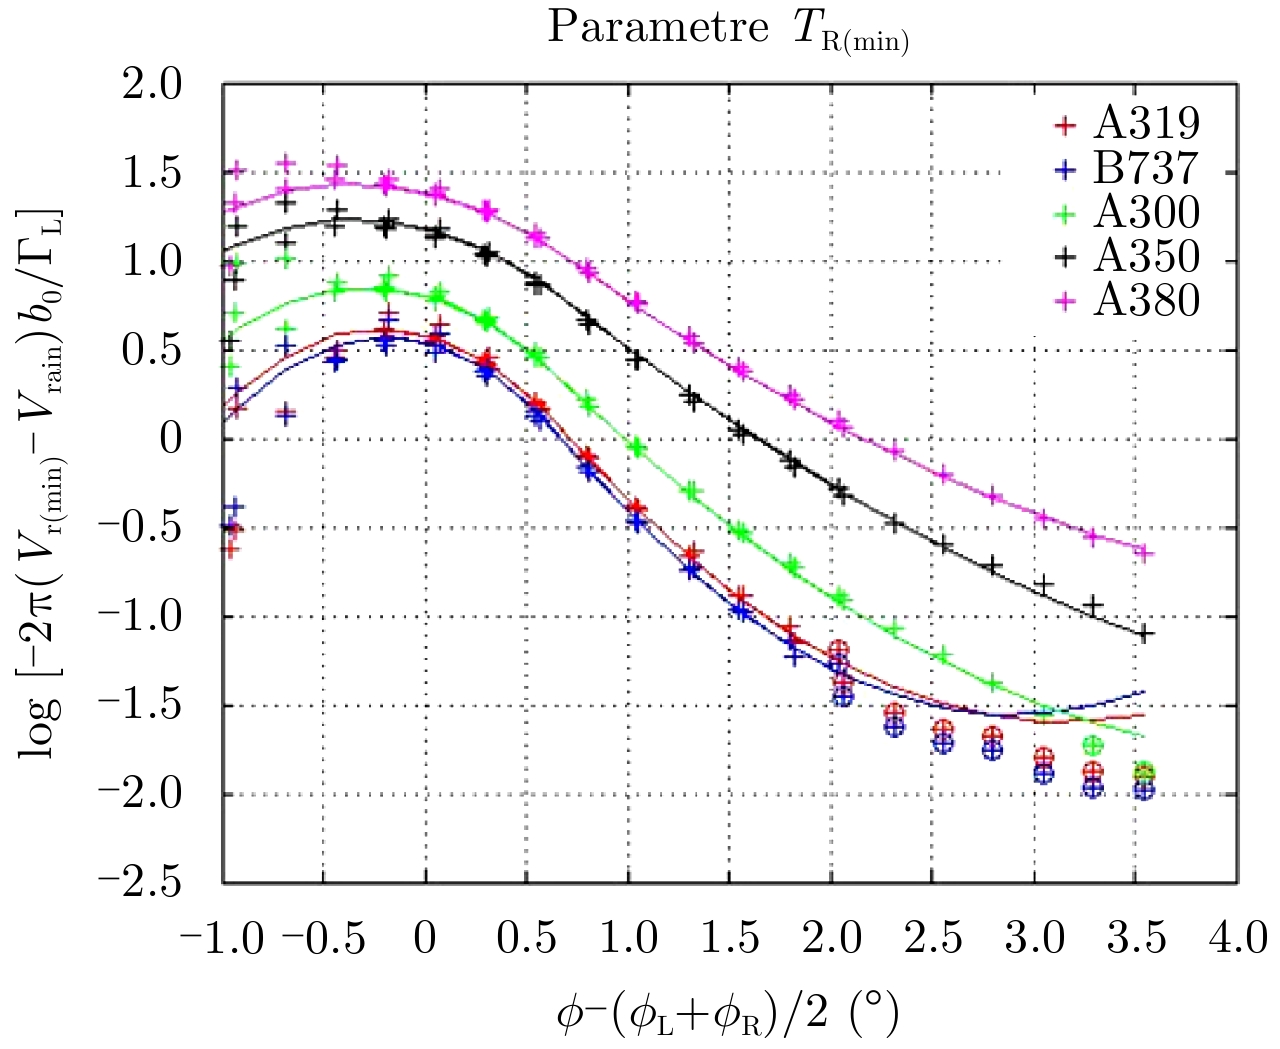
| $\left. \begin{array}{l} \frac{{{V_{\rm{r}}} - {V_{{\rm{rain}}}}}}{{{\Gamma _{\rm{L}}}}} \cdot 2 \cdot {{π}} \cdot {b_0} = {T_{{\rm{L}}(\max )}} \\ \quad \approx {A_{\rm L}}\left( {0,\frac{{\phi - {\phi _{\rm{L}}}}}{{{\phi _{{\rm{beam}}}}}}} \right)\\ \frac{{{V_{\rm{r}}} - {V_{{\rm{rain}}}}}}{{{\Gamma _{\rm{R}}}}} \cdot 2 \cdot {{π}} \cdot {b_0} = {T_{{\rm{R}}(\min )}} \\ \quad \approx - {A_{\rm R}}\left( {0,\frac{{\phi - {\phi _{\rm{L}}}}}{{{\phi _{{\rm{beam}}}}}}} \right)\end{array} \right\}$ | (5) |
The Fig. 9 and Fig. 10 give the parameters TL(max) and TL(min) as a function of the relative elevation
|
Fig.9 Comparison between TL(max) and its fitted function-All beams |
|
Fig.10 Comparison between TR(min) and its fitted function- All beams |
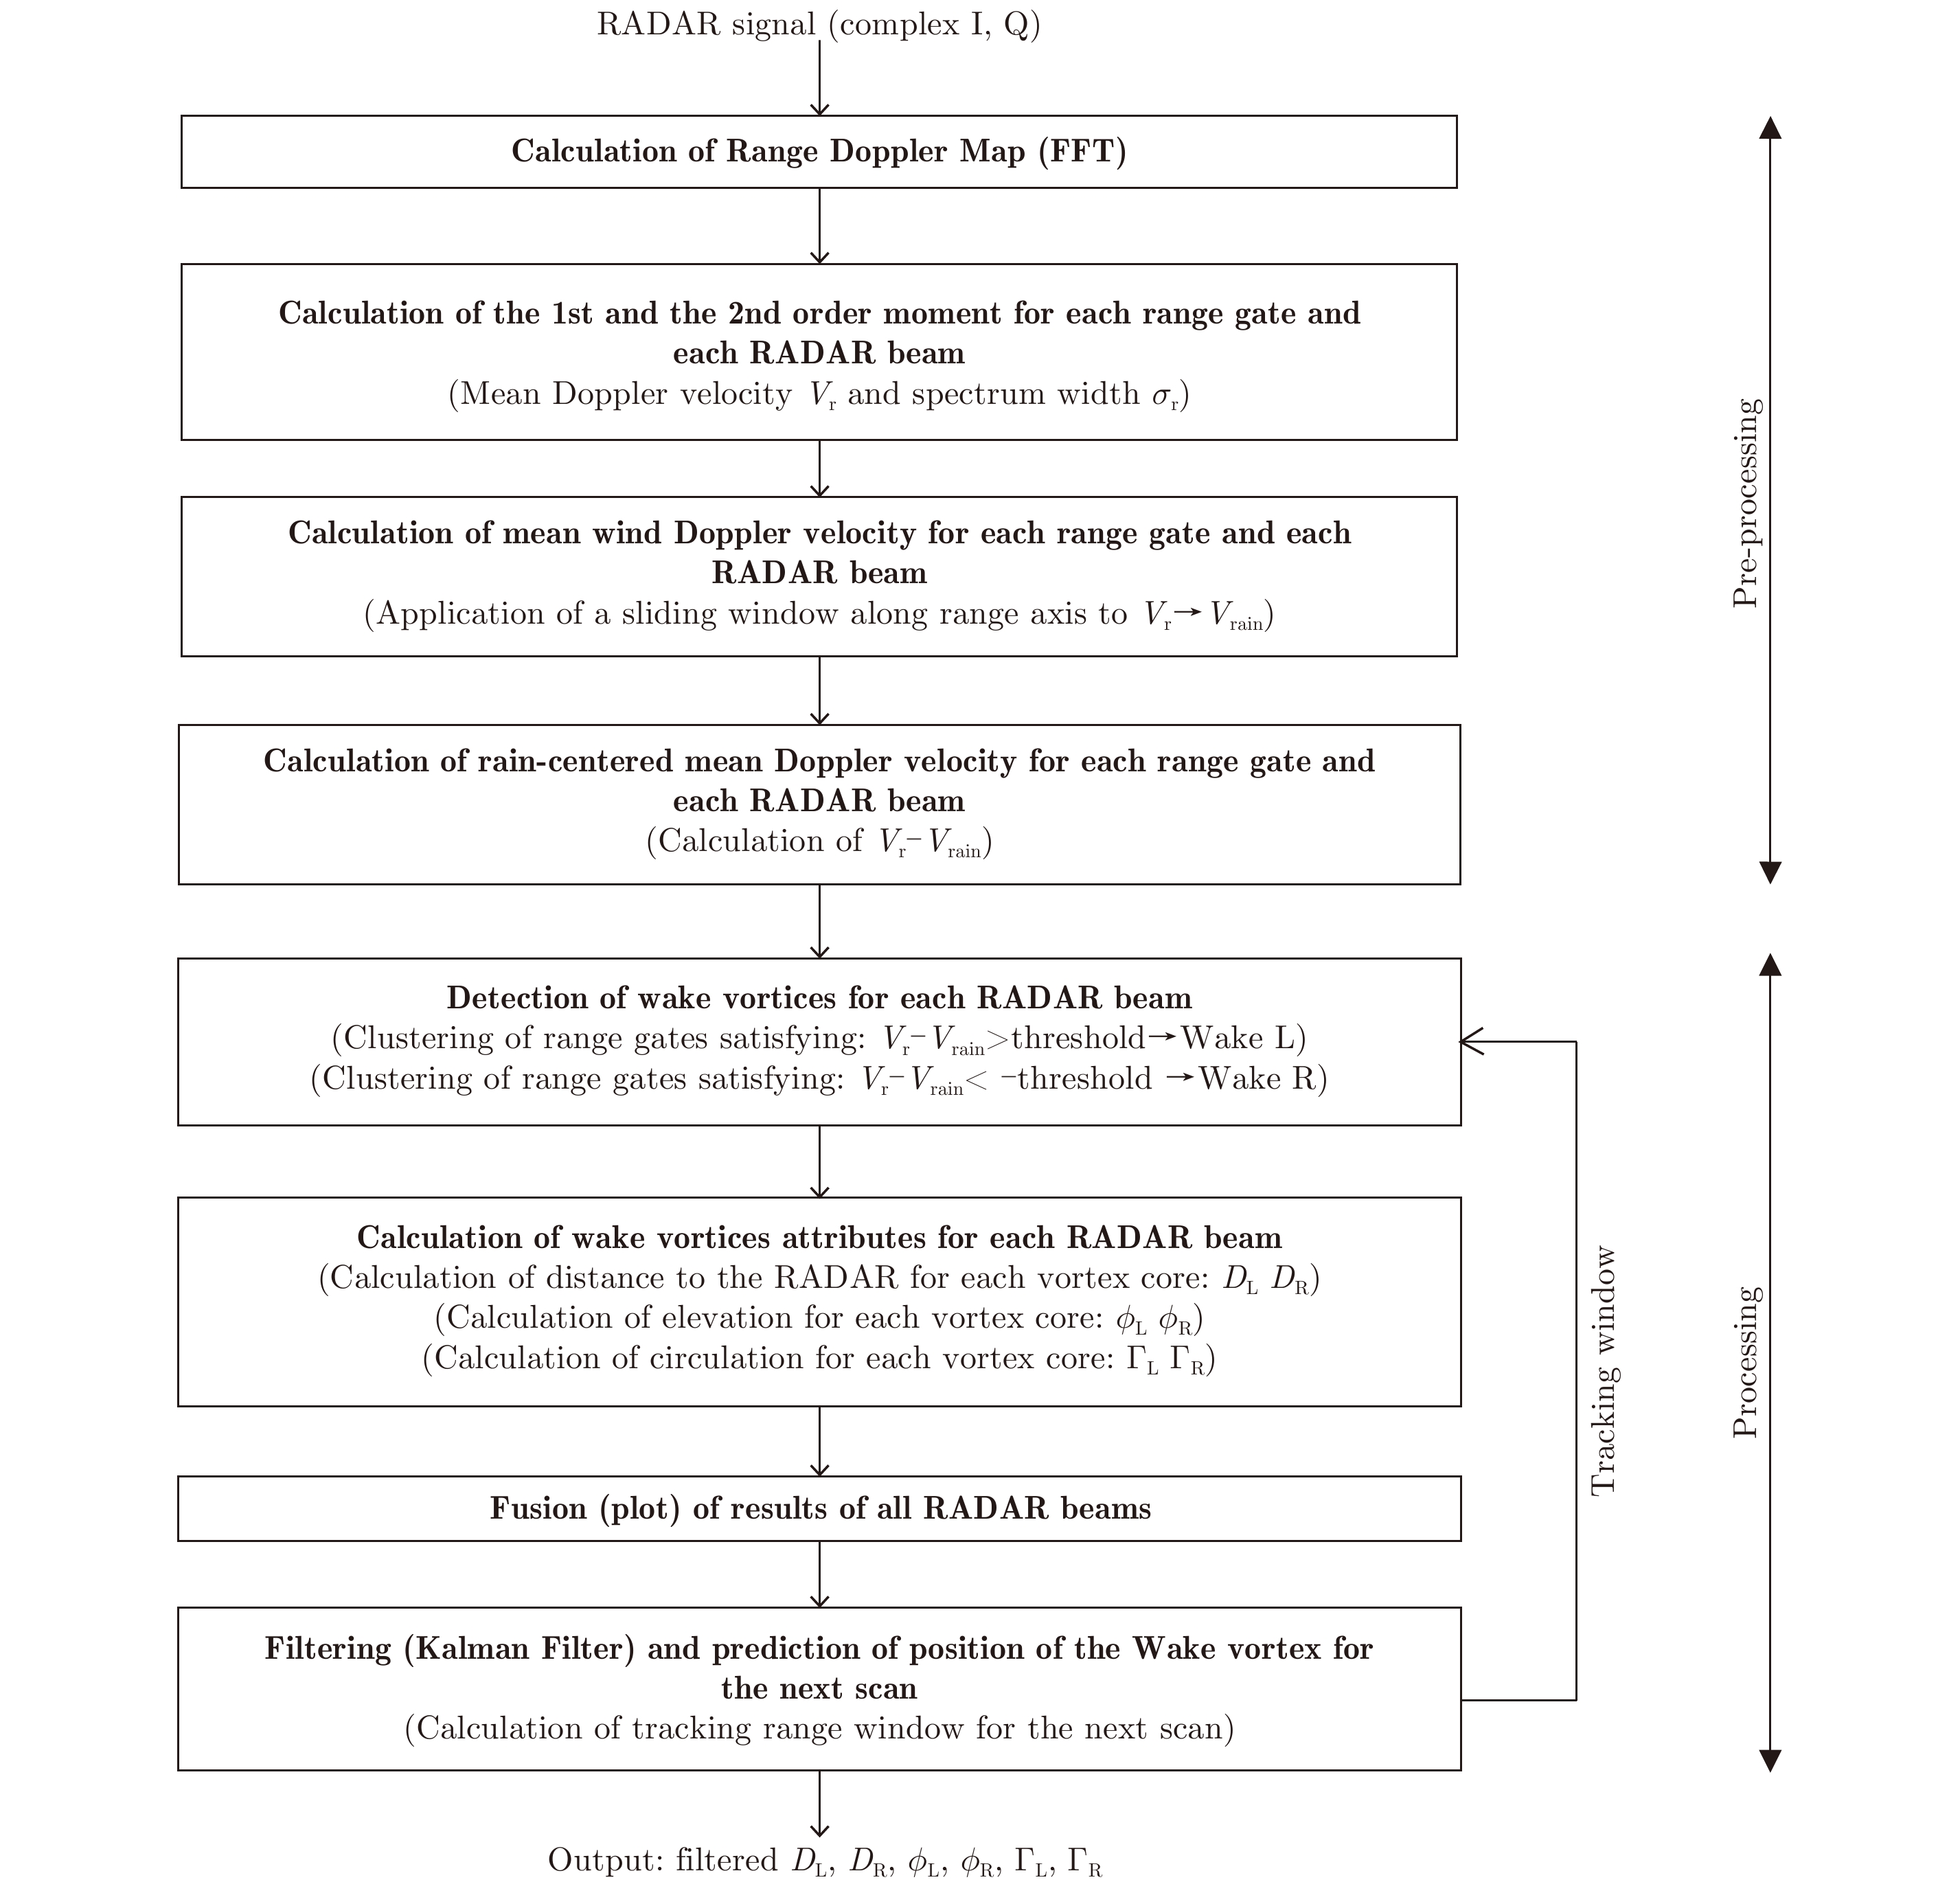
The main steps of the processing are given on Fig. 11.
The pre-processing phase aims to calculate the 1st and 2nd order moment and to remove the wind contribution.
The processing phase aims to detect the vortices and to calculate the wake parameters generated by an aircraft. The empiric formulas giving the mean radial Doppler velocity and the cumulated spectrum width obtained at Section 3.2 are used during this phase.
|
Fig.11 Block diagram of wake vortex processing |
The performances of the algorithm described in previous Section 3.3 are evaluated for different aircrafts and for scenarios defined in Section 3.1.
Let us define the elevation of the middle of core L and R:
| $\phi = \frac{{{\phi _{\rm{L}}} + {\phi _{\rm{R}}}}}{2}$ | (6) |
For each aircraft and each beam, following metrics are used to evaluate the performances as a function of
• Wake vortex range error:
| $\left. \begin{align}& \Delta {D_{\rm{L}}} = {D_{\rm{L}}} - {D_{{\rm{L}}\left( {{\rm{est}}} \right)}}\\& \Delta {D_{\rm{R}}} = {D_{\rm{R}}} - {D_{{\rm{R}}\left( {{\rm{est}}} \right)}}\\& \Delta {b_{\rm{0}}} = {b_{\rm{0}}} - {b_{\rm{0}}}_{\left( {{\rm{est}}} \right)}\end{align}\!\!\!\!\!\!\!\!\!\!\!\!\!\!\!\!\!\!\!\!\!\!\!\!\!\!\!\!\!\!\!\!\!\!\!\! \right\}$ | (7) |
• Wake vortex elevation:
| $\begin{array}{l}{\phi _{{\rm{L}}\left( {{\rm{est}}} \right)}}\\{\phi _{{\rm{R}}\left( {{\rm{est}}} \right)}}\end{array}$ |
• Wake vortex circulation error (in %):
| $\left. \begin{align}& \frac{{\Delta {\Gamma _{\rm{L}}}}}{{{\Gamma _{\rm{L}}}}} = \frac{{{\Gamma _{\rm{L}}} - {\Gamma _{{\rm{L}}\left( {{\rm{est}}} \right)}}}}{{{\Gamma _{\rm{L}}}}}\\& \frac{{\Delta {\Gamma _{\rm{R}}}}}{{{\Gamma _{\rm{R}}}}} = \frac{{{\Gamma _{\rm{R}}} - {\Gamma _{{\rm{R}}\left( {{\rm{est}}} \right)}}}}{{{\Gamma _{\rm{R}}}}}\end{align}\!\!\!\!\!\!\!\!\!\!\!\!\!\!\!\!\!\!\!\!\!\!\!\!\!\!\!\!\!\!\!\!\!\!\!\! \right\}$ | (8) |
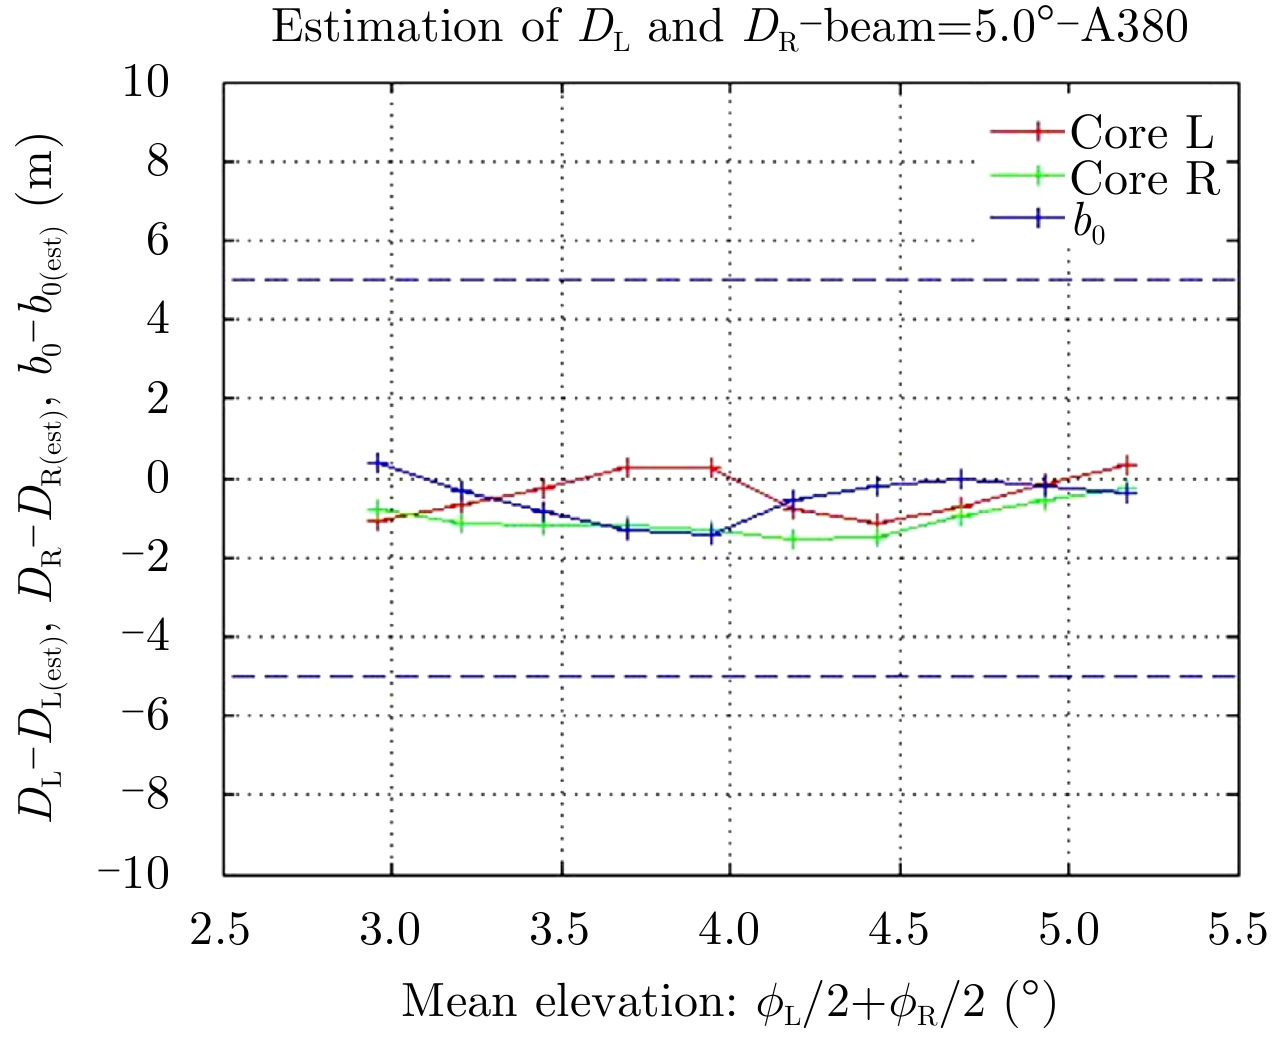
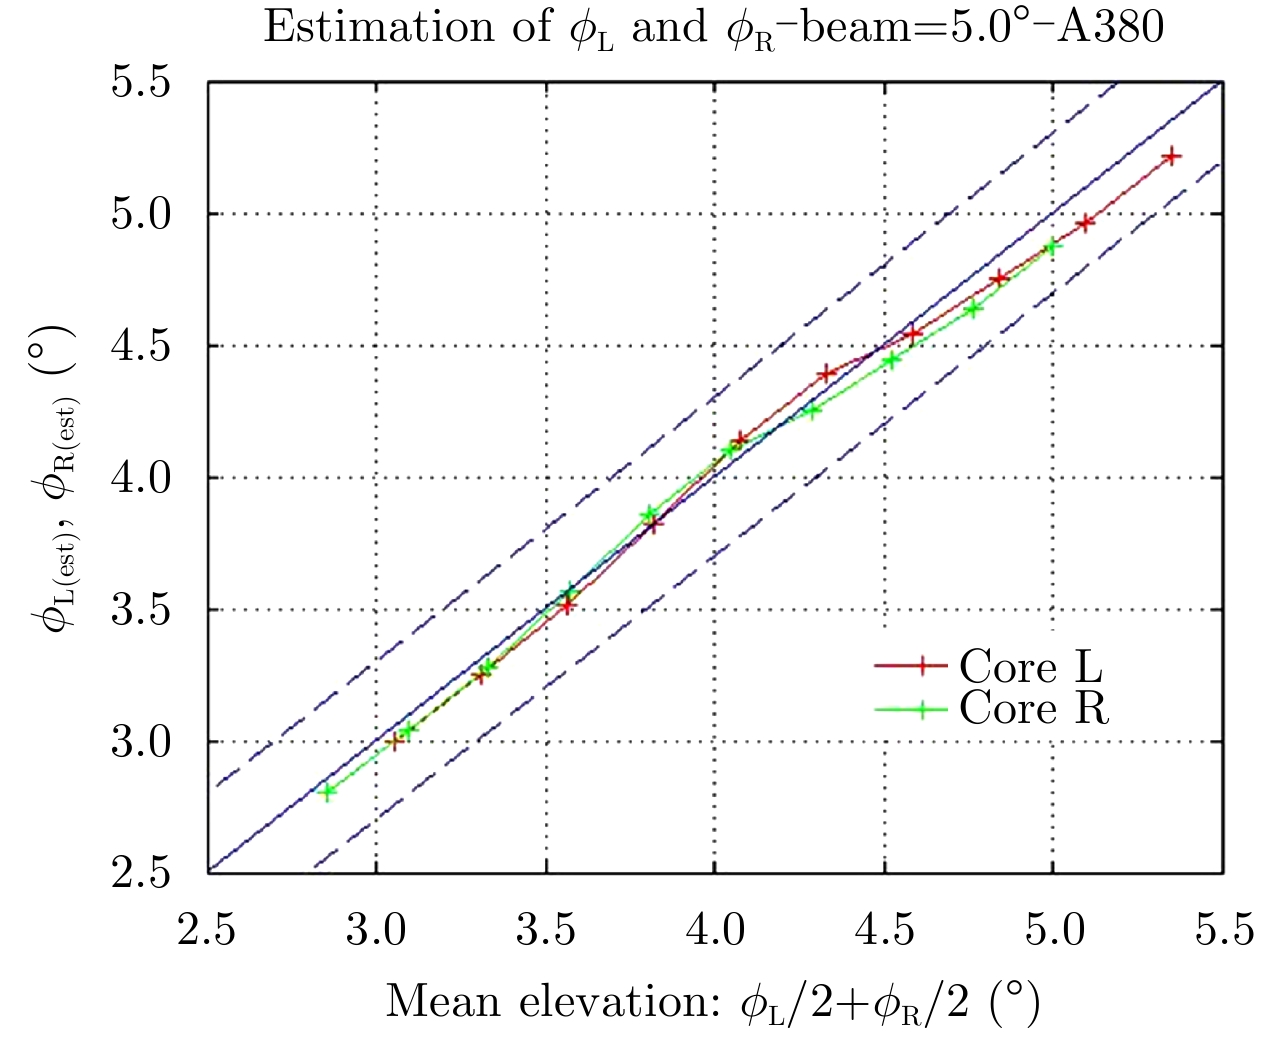
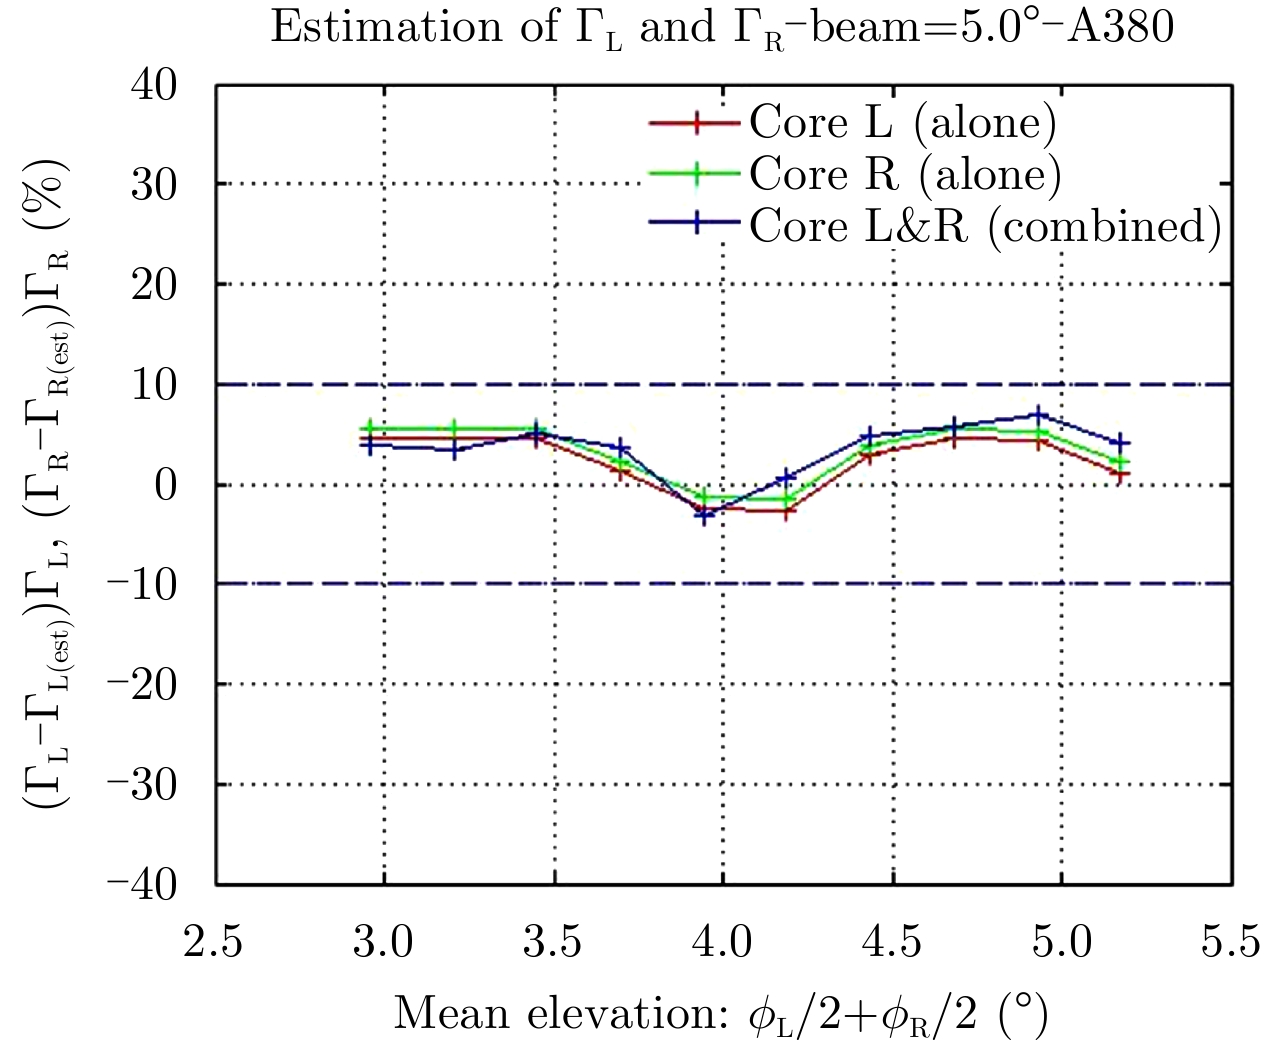
The results are presented for an A380 aircraft and for a RADAR with constant elevation (=5°) on Fig. 12, Fig. 13 and Fig. 14.
|
Fig.12 Range evaluation-A380-RADAR beam elevation 5° |
|
Fig.13 Elevation evaluation-A380-RADAR beam elevation 5° |
|
Fig.14 Circulation evaluation-A380-RADAR beam elevation 5° |
On these figures, a result for a detectable vortex is represented with a “plus” (+) and a result for a not detectable vortex is represented with a “circle” (o).
The first results show that the proposed algorithm has following theoretical performances:
• Range accuracy: ±5 m
• Elevation: ±0.5°
• Circulation: ±10% for categories S and H aircraft and ±15% for category M aircraft.
These performances are achievable when the maximum of mean Doppler velocity is significantly greater than the mean wind Doppler velocity. These results are the best achievable since a lot of hypotheses are assumed for simplification:
• The simulated RADAR signal are noiseless.
• The vortices are identical and have the same circulation.
• The wind is assumed constant and turbulence is ignored.
4 Analys of Recorded DataThis section presents the results of wake vortices detection algorithm based on data recorded during the PARIS-CDG campaign.
The behavior of wake vortices is analyzed in Section 4.1 for one aircraft of category H.
A statistical analysis is performed in Section 4.2 for aircrafts recorded during the data collection performed in PARIS-CDG from October 2014 to November 2015.
4.1 Example of behavior of wake vortexThe section aims to analyze the wake vortices behavior as function of time for a landing A342 (category H) having large circulation.
The algorithm to retrieve the wake vortices characteristics is based on some assumptions which need to be discussed. In this section, we show that the RADAR signal needs to be pre-processed before applying the algorithm to retrieve the wake vortices characteristics.
The mandatory pre-processing algorithms are:
• Removal of ground clutter.
• Compensation of mean wind/rain Doppler velocity.
• Control of false wake detection rate:
o Search of wake vortices within a range window.
o Calculation of the detection threshold.
The main assumptions are that the RADAR signal is clutter free and that wind Doppler velocity is constant along the range axis. From Fig. 15, this is clearly not the case. On this figure, the power spectrum of wind alone is represented for the same scan at constant azimuth and for two different elevations: the beam at 2° corresponds to a “low elevation” measurement and the beam at 4° corresponds to a “high elevation” measurement. On this example, we see that the RADAR signal is clearly affected by ground clutter at low elevation and that the mean Doppler velocity is 10±3 m/s depending on range.

|
Fig.15 Range/Doppler map-Impact of ground clutter |
The Doppler wind speed measured by the RADAR is mainly the cross wind (normal to the glide). During the data collection performed in PARIS-CDG, the observed cross wind varies from –5 m/s to 10 m/s.
During the analysis of data, it was observed that the wake vortex signature was too much corrupted to be used when the ground spectrum and the wind spectrum overlap. The lower beam (2°) is therefore ignored in following analysis. For other beams, the mean Doppler velocity is compensated from fluctuations due to the wind as illustrated for each beams on top figure of Fig. 16. This compensation makes the detection threshold independent from wind fluctuation and simplifies the detection algorithm.
After compensation of mean wind Doppler velocity, a random residual fluctuation remains especially at range around 2000 m where the signal to noise ratio is small. This is illustrated on bottom figures of Fig. 16.

|
Fig.16 Pre-processing-A342-2015/01/28 05:22-All beams-scan 2 |
Top figures:
• Red curve: Mean Doppler velocity.
• Blue curve: Wind Doppler velocity.
Bottom figures:
• Red curve: normalized mean Doppler velocity.
• Horizontal blue lines: detection threshold.
• Vertical blue lines: window where the vortices are search.
• Vertical green lines: window where the detection threshold is calculated.
The detection of wake vortices is illustrated on bottom figures for each beam of Fig. 16: on this figures, the modulus of Doppler velocity (red curve) is compared to a detection threshold (horizontal blue lines). A vortex is declared “detected” when the modulus of mean Doppler velocity is greater than the threshold and located in corresponding range cells. A positive mean Doppler velocity is the signature of core L vortex and a negative mean Doppler velocity is the signature of core R vortex.
Since the mean Doppler velocity depends on circulation of wake vortices (see Section 3.2) and is decreasing with time, the detection threshold needs to be as low as possible.
In order to control the false detection rate, the vortices are searched in a limited range window (vertical blue lines) where the vortices are expected to be. The range window is predicted from scan to scan, the initial window being centered on the glide.
The detection threshold is therefore equal to K·
The last assumption for the algorithm described in Section 3.3 to be discussed is if it is possible to retrieve the circulation and the elevation when a model of the mean Doppler velocity as a function of range is available.
The robustness of model developed in Section 3.2 needs to be analyzed. It could depend (at least) on the wake vortex model, on the wind turbulence model and on the model used to describe the interaction between wake vortices and rain droplet motion.
The robustness to turbulence and interaction with rain droplets is statistically analyzed in Section 4.2 because of the random nature of the problem. In this section, the analysis is focused on the robustness to the model to the wake model.
In Section 3.2, the wake vortex model is a Burnham-Hallock one. The two vortices are identical counter-rotating with the same circulation at the same altitude.
A lot of other models are available in open literature. Most of them agree to describe the velocity field when it is evaluated far from center of wake vortices. When several measurements are available, the proposed algorithm takes advantage of this property by selecting the beams satisfying this condition in order to be independent of the model.
It is well known that the wake vortex structure is changing with its age, defined as the time elapsed since the aircraft generated the wake vortices. Following situations should be observed on records:
• The expected mean Doppler velocity is in accordance with assumption of Section 3.2 for the very few first measurements (2 or 3 rotation scan of the antenna corresponding to 21 s).
• After 3 scans, the observed that signature is distorted: When both wake vortices are detected, their signatures on mean Doppler velocity become dissymmetric. For some scans, the signature of one vortex is no more visible.
The proposed algorithm is developed to recognize these situations and to extract following parameters to characterize the vortices at each antenna scan:
• The Signal to Noise Ratio (SNR).
• The maximum Vr(max) and the minimum Vr(min) of Doppler velocity.
• The distance to the RADAR of each vortex DL and DR.
The SNR is used to evaluate the rain rate and to verify the integrity of data. For instance, if the SNR is less than 5 dB (meaning there is no rain), it is not possible to evaluate the wake vortices parameters and data are discarded.
The maximum Vr(max) and the minimum Vr(min) of Doppler velocity are related to the circulation
| $\left. \begin{array}{l}{V_{{\rm{r}}(\max )}} - {V_{{\rm{rain}}}} \approx \frac{{{\Gamma _{\rm{L}}}}}{{2 \cdot {{π}} \cdot {b_0}}} \cdot {A_{\rm{L}}}\left( {0,0} \right)\\{V_{{\rm{r(min)}}}} - {V_{{\rm{rain}}}} \approx - \frac{{{\Gamma _{\rm{R}}}}}{{2 \cdot {{π}} \cdot {b_0}}} \cdot {A_{\rm{R}}}\left( {0,0} \right)\end{array} \right\}$ | (9) |
The coefficients AL and AR are dependent on the aircraft wing span b. These relations are used in Section 4.2 to calibrate the algorithm using the first measurements:
| ${\Gamma _0} = \frac{{g \cdot M}}{{\rho \cdot U \cdot \displaystyle\frac{{{π}}}{4} \cdot b}}$ | (10) |
In this equation, M is the landing weight (=0.85·MLW where MLW is the maximum landing weight), g the gravity (=9.81 m/s2), ρ the air density (=1.2 kg/m3), U the landing speed.
The observation of Vr(max) and Vr(min) as function of time gives access to the decay of vortices and to its age, defined as the number of scans where the vortices are detected expressed in seconds.
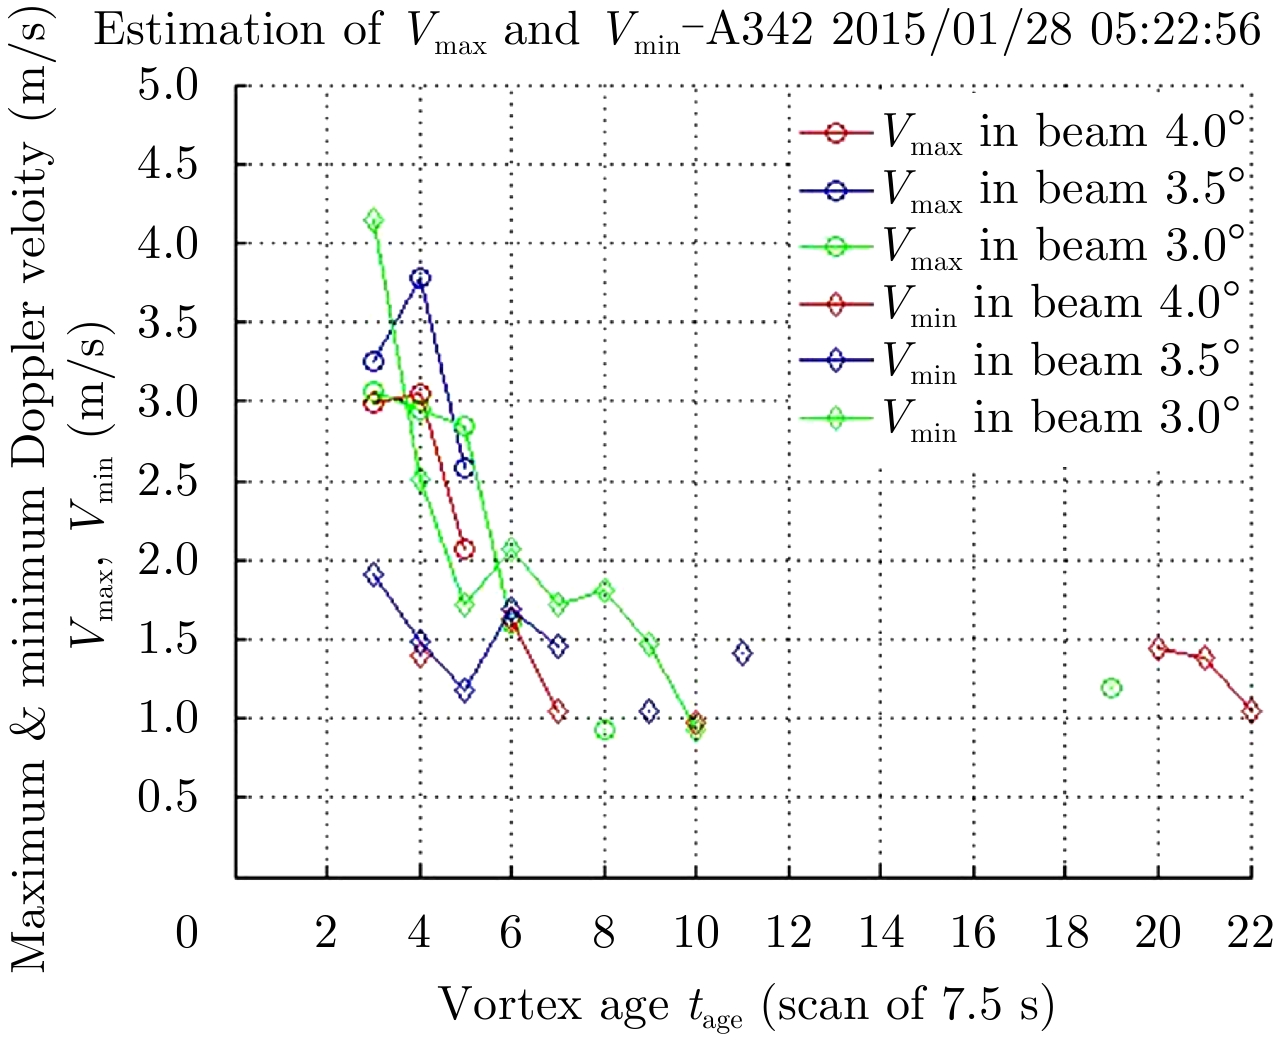
An example is given at Fig. 17 for an A342 aircraft. On this figure, the value of Vr(max) and Vr(min) is provided for each RADAR beam before the clustering of beams to form a RADAR wake plot and false detections could occur. However, when false detections are discarded, the decrease of Vr(max) and Vr(min) is clearly observed as predicted by simulations of the decay of the circulation of wake vortex. For this particular example, the vortex age is about 45 s (corresponding to 6 scans).
|
Fig.17 Vmin & Vmax-A342-2015/01/28 05:22-All beams |
A statistical analysis of the age of vortices is performed at Section 4.2.
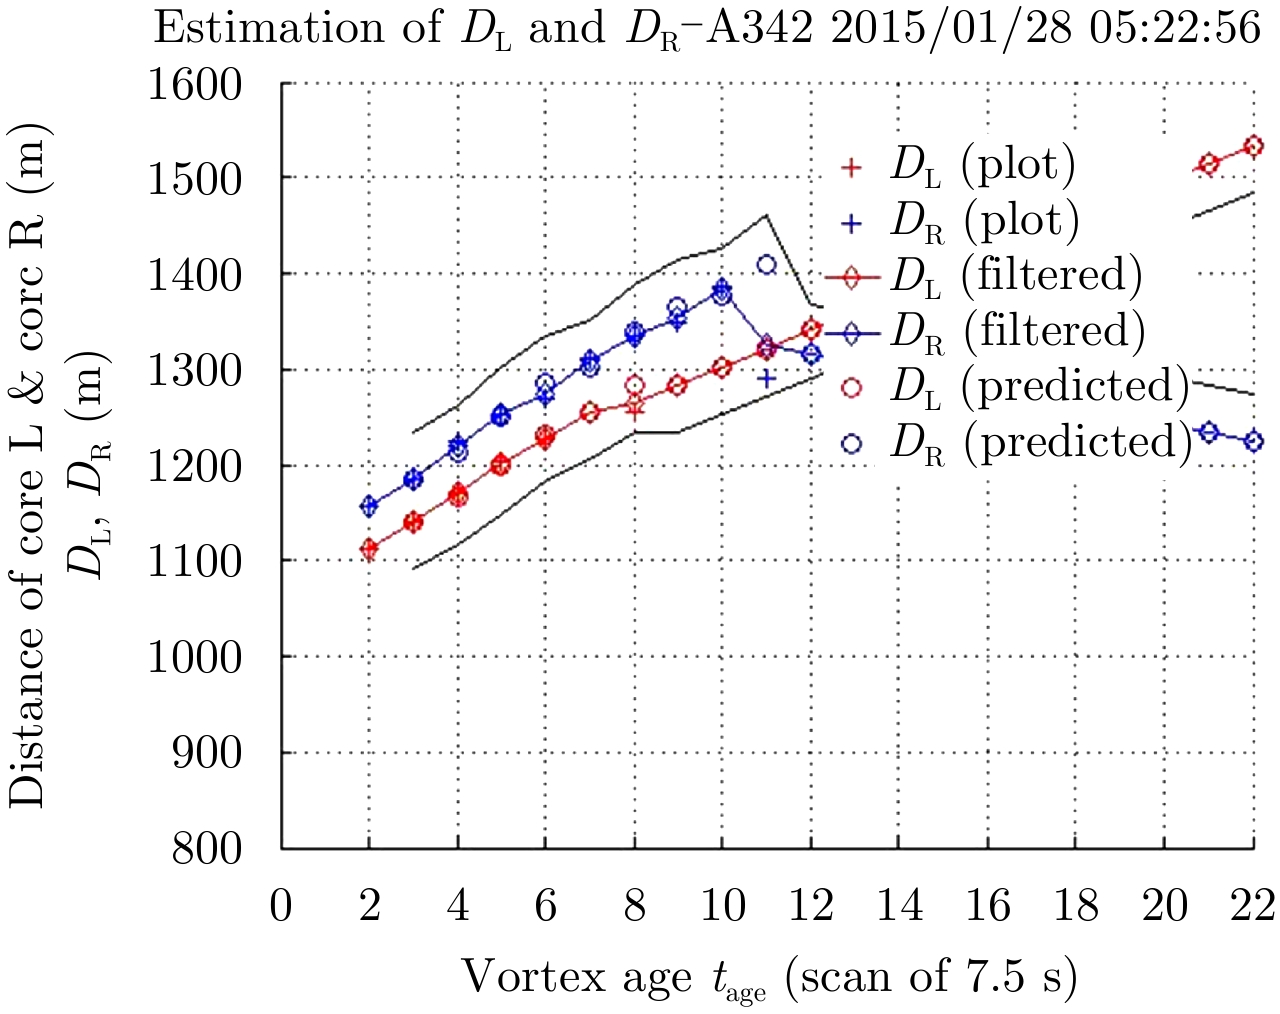
The distance to the RADAR of each wake vortex (respectively DL and DR) is calculated by combining the elementary beam measurements, to form a RADAR wake plot. The RADAR wake plot is then time filtered (Kalman filter):
• The Kalman prediction output is used to predict the position of the wake vortices at next scan.
• The Kalman filtered output is provided to the final user.
An example is provided at Fig. 18 for an A342 aircraft. On this figure, we can observe the cross wind influence: the wake vortices are pushed away from glide path with a velocity of about 4 m/s for both aircrafts. This value is close to the cross wind (equal to the mean wind Doppler velocity) directly calculated by the RADAR.
|
Fig.18 DL & DR-A342-2015/01/28 05:22-All beams |
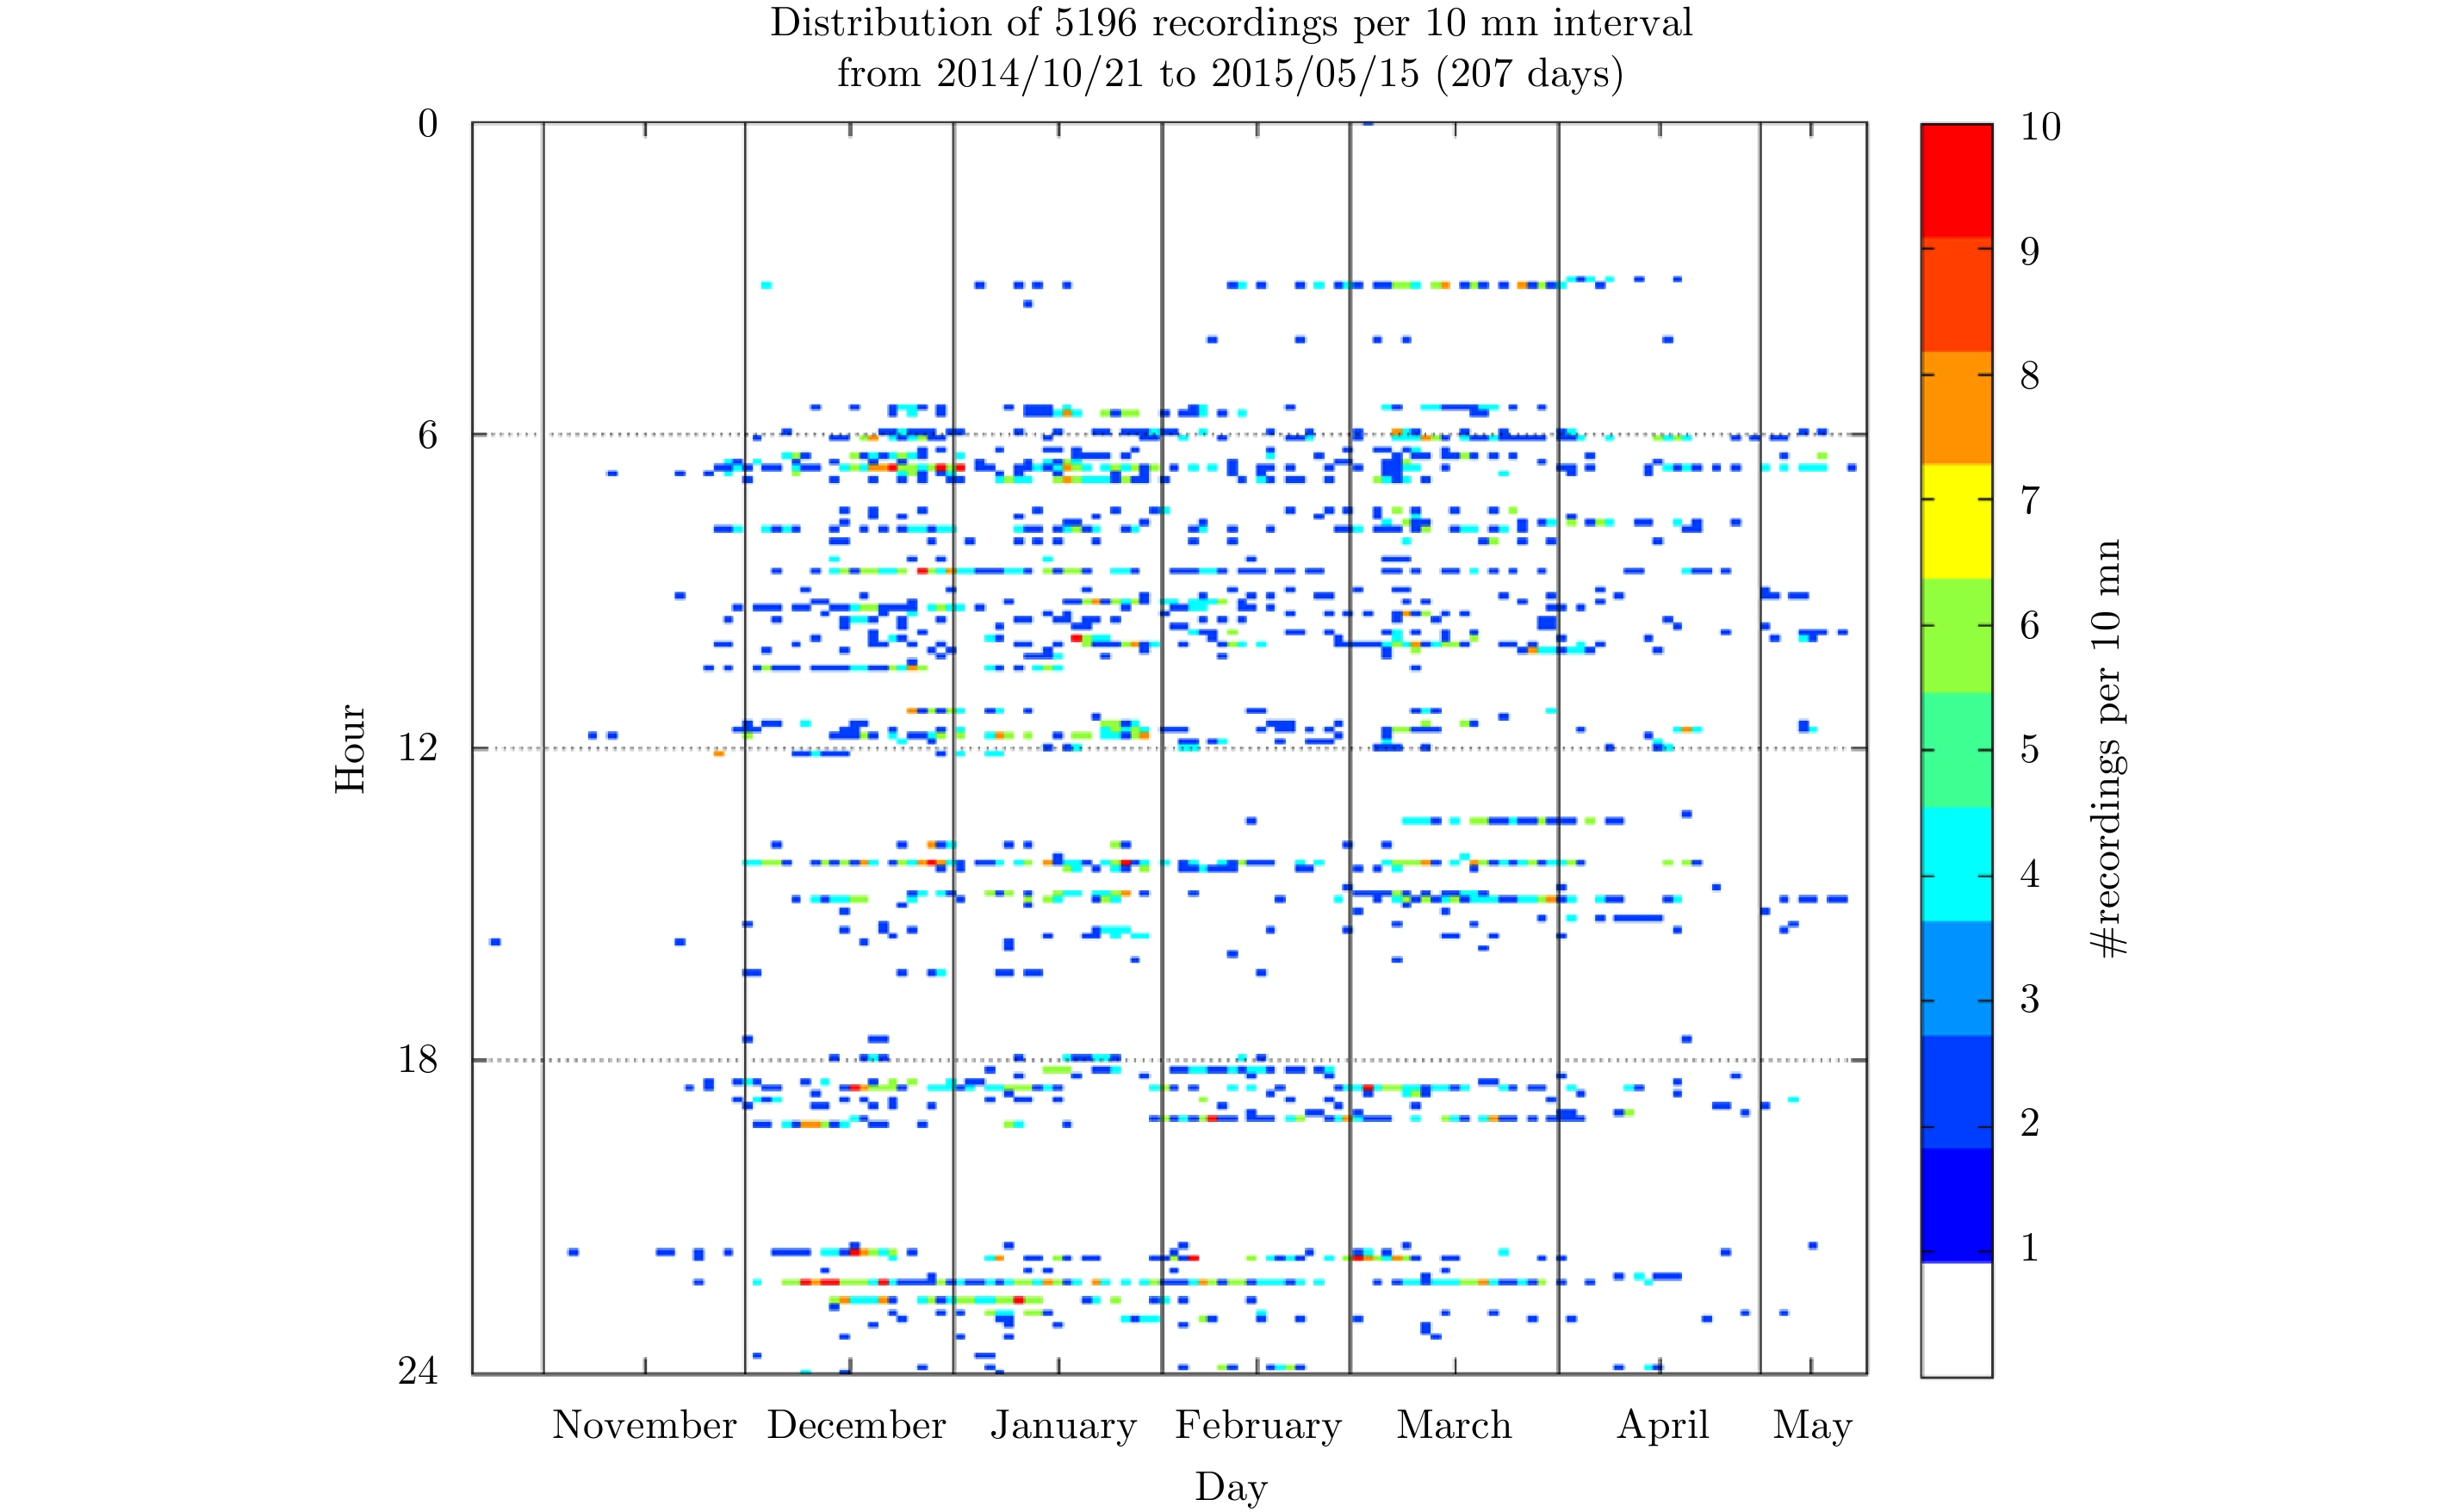
The RADAR recorded the I&Q data for aircrafts landing at threshold 27R from October 2014 to November 2015. The availability of data is given atFig. 19 for the time period from 2014/10/21 to 2015/05/15 where the RADAR was operational. Before 2014/10/21, the recording tools needed some tuning and after 2015/05/21 the RADAR was in failure.
To perform a statistical analysis, the data are sorted based on following criteria:
• The ICAO category M, H and S.
• The ICAO type: designation by 4 characters, ex: A310, A318, B733.
• The presence of rain.
The criterion used to decide if rain is present is based on signal to noise ratio (SNR) calculated by the RADAR. When the SNR is close to 0 dB, there is no rain within the domain scanned by the RADAR and the detection of wake vortices is not possible. The empirical criterion used during this study to decide if rain is present is SNR > 5 dB.
Fig. 19 reports the number of recordings per 10 mn interval along the day (y-axis) and for the all 207 days (x-axis): about 95% of intervals have no data and maximum is up to 10 times/10 mn.
|
Fig.19 Data availability-Threshold 27R landing recordings |
Different aircrafts and a large variety of models have been observed. Following Tab.1 resumes their distributions, without rain or with rain:
| Tab.1 Statistics about observed landing aircrafts |
This section reports the meteorological conditions observed during the data collection campaign performed at PARIS-CDG. Meteorological data are available from 2014/11/24 to 2015/01/10.
The MET station is close to 27R threshold and 1200 m distant from the RADAR. Instantaneous wind direction and speed, and also rain rate are considered.
Fig. 20 shows the direction distribution and Fig. 21 presents the speed modulus distribution.
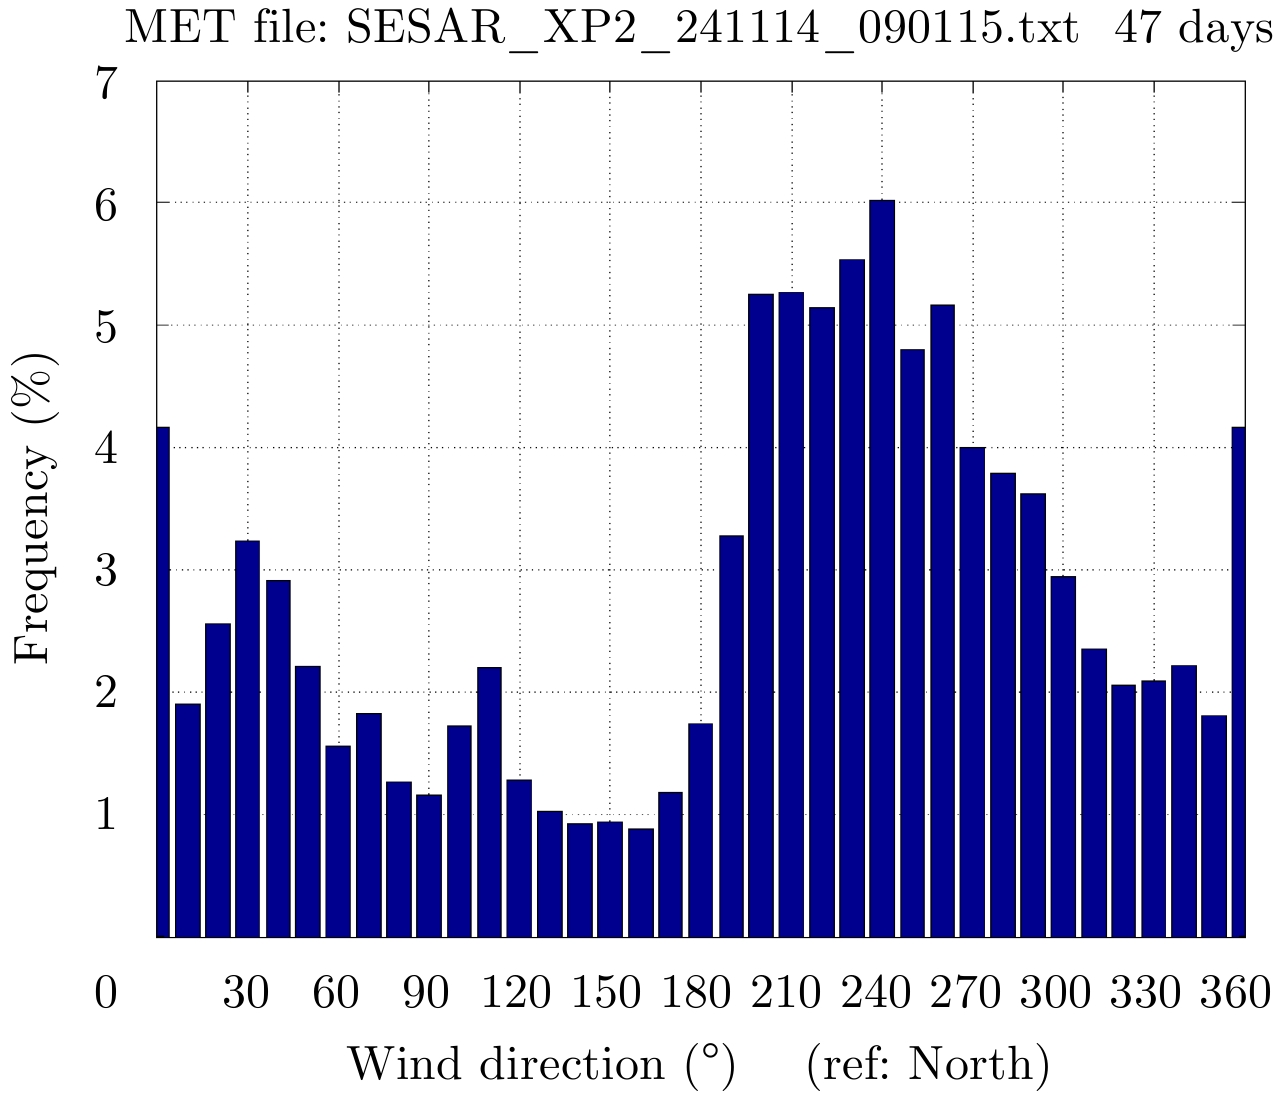
|
Fig.20 Histogram of instantaneous wind direction (MET data) |
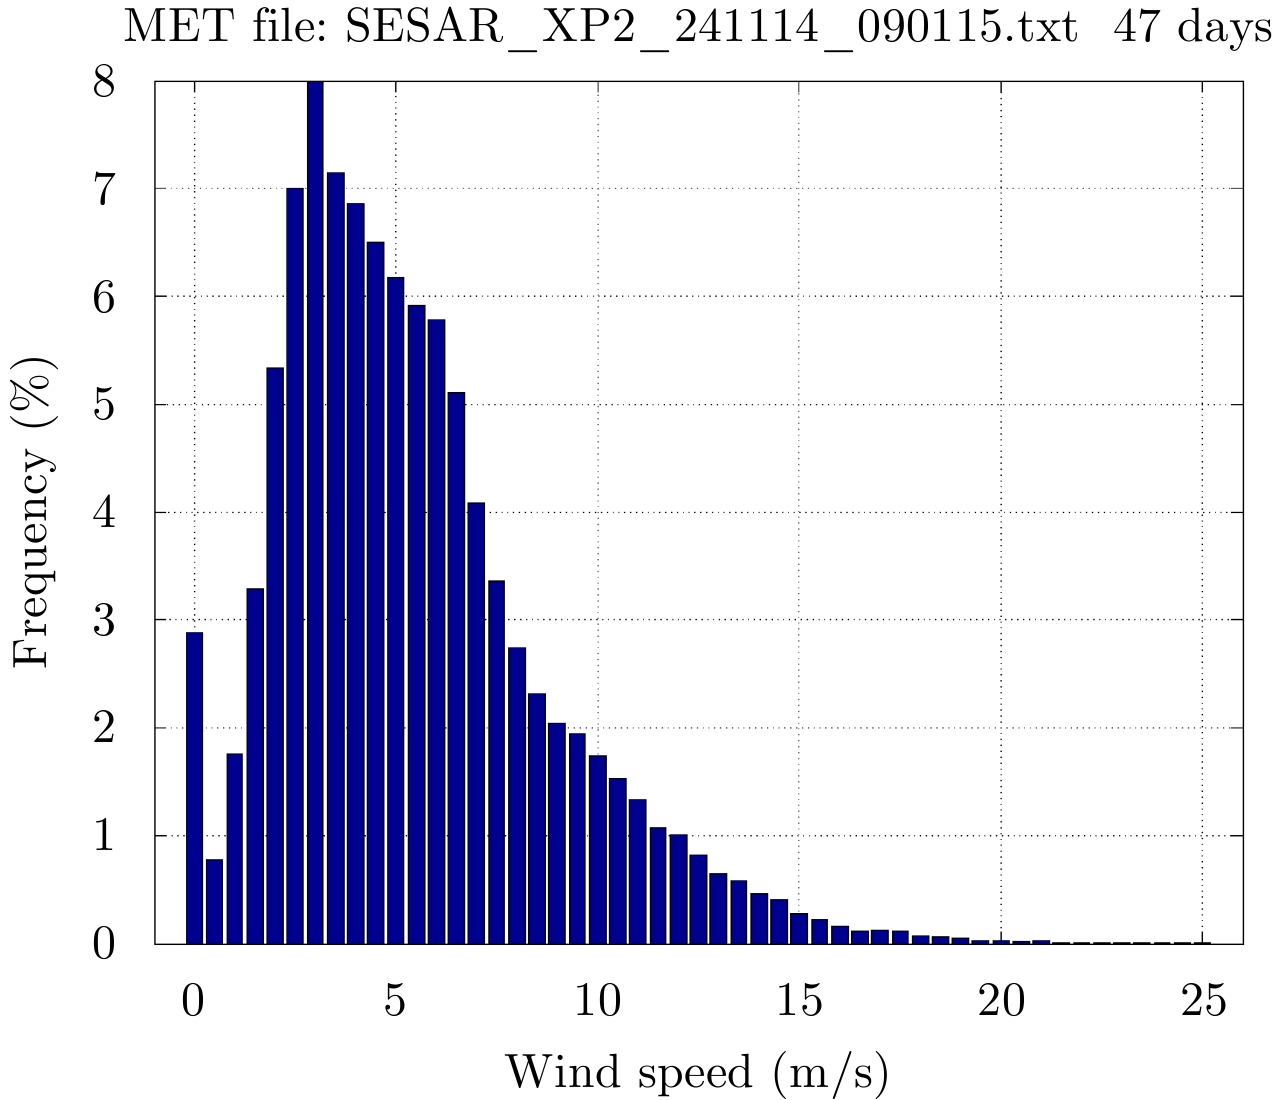
|
Fig.21 Histogram of instantaneous wind speed (mean=5.4 m/s, MET data) |
Among the 67681 recordings with a 1 mn quantum, 67677 come with exploitable format (wind direction 0° to 360° with 10° step): it is noted that all recordings (#1952) associated to 0° direction have zero speed. Wind blows mostly from S-O sector and the wind speed is less than 25 m/s.
4.2.3 Probability to detect wake vortices & wake vortices ageFor the X band RADAR, the probability to detect wake vortices is defined as the percentage of recorded aircrafts under rainy condition for which the RADAR could find the signature of the vortices generated by the aircraft.
An aircraft is “detected” when its wake vortices are seen within the five first RADAR scans time interval after the aircraft crossed the observed sector. Rainy condition is sampled scaling up SNR from 5 to 20 dB: Following Tab.2, Tab.3 gives the number of detections per category (M, H and S).
| Tab.2 Calculation of detection probability 1/2 |
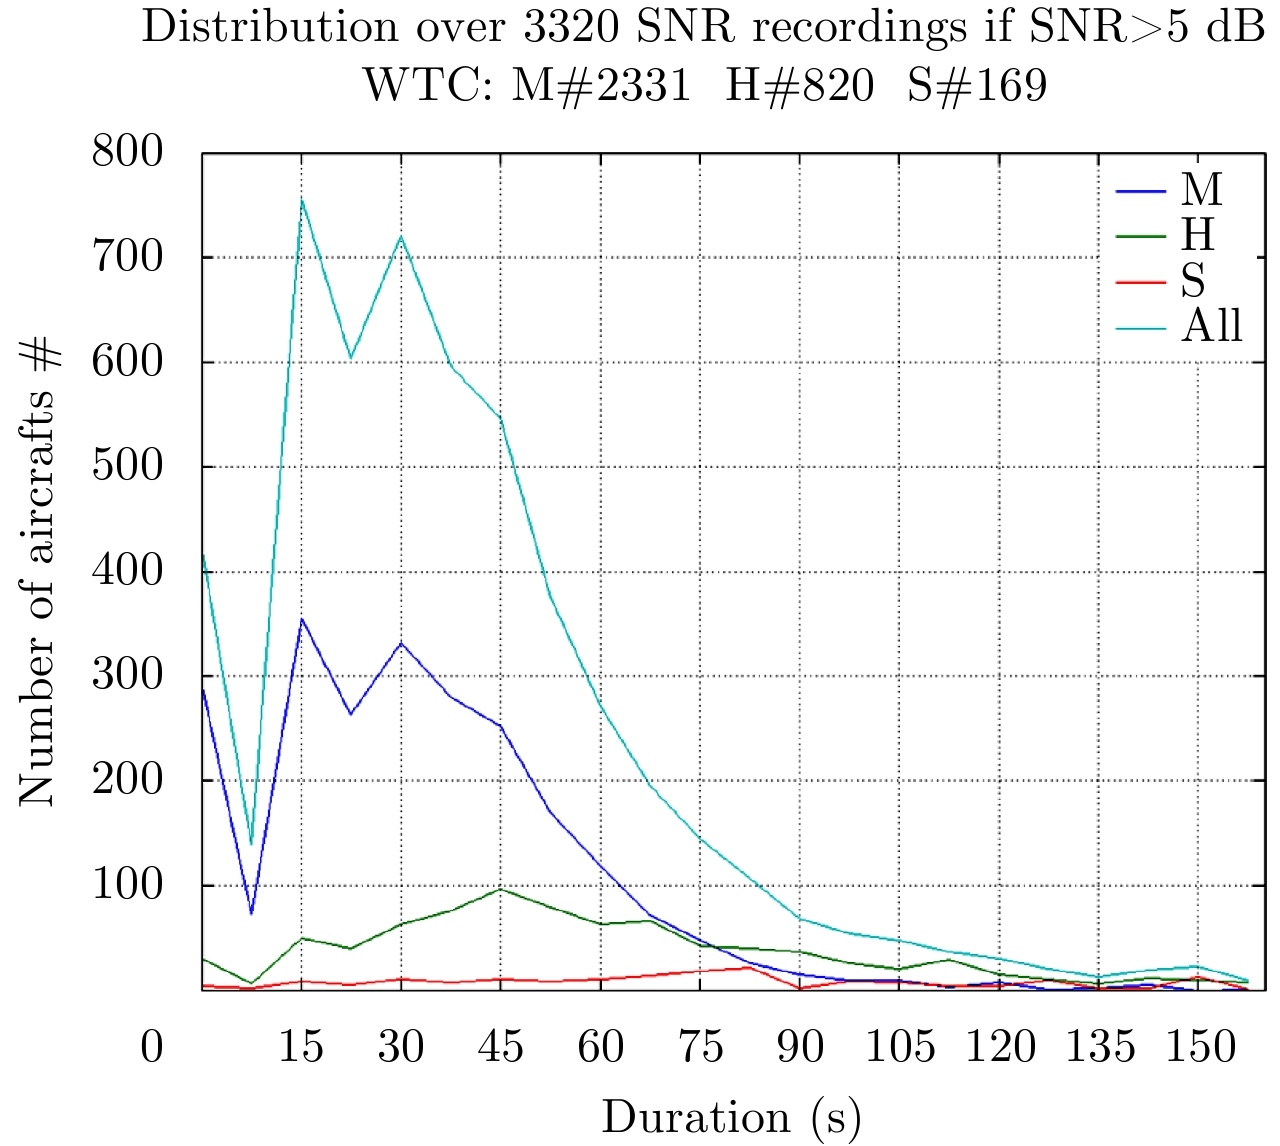
|
Fig.22 Durations of vortices for all landing aircraft per category-Threshold 27R |
| Tab.3 Calculation of detection probability 2/2 |
The Fig. 22 deals with vortex duration. It gives an overview of the numbers of recordings versus the set of durations counted on 7.5 s or 15 s scan basis. The global mean duration is 45.8 s (a bit more than 6 scans). The mean value is 37.1 s (resp. 61.6 s, 77.2 s) for the M category (resp. H and S).
4.2.4 Circulation retrievalBefore the data collection campaign, it was expected to calibrate the RADAR with the LIDAR deployed by the 6.8.1 project. Since the LIDAR was not deployed, the calibration could not be done.
The data collected could however be used to verify partially the assumptions made to retrieve the circulation from RADAR measurements. These results are presented in this section.
From simulation results presented in Section 3.3, the maximum and the minimum of Doppler velocity are closely approximated by (the notations are those of Section 3.3):
| $\left. \begin{array}{l}{V_{{\rm{r(max)}}}} - {V_{{\rm{rain}}}} \approx \frac{{{\Gamma _{\rm{L}}}}}{{2 \cdot {{π}} \cdot {b_0}}} \cdot {A_{\rm{L}}}\left( {0,0} \right)\\{V_{{\rm{r(min)}}}} - {V_{{\rm{rain}}}} \approx - \frac{{{\Gamma _{\rm{R}}}}}{{2 \cdot {{π}} \cdot {b_0}}} \cdot {A_{\rm{R}}}\left( {0,0} \right)\end{array} \right\}$ | (11) |
When a landing aircraft is located at a distance of 1400 m from the threshold, it initiates wake vortices at an altitude close to 70 m above ground level (see Fig. 4).
It means that the RADAR performs the first wake vortices measurement for an azimuth between 355° and 360° (normal to the glide) and a distance between 1100 m and 1200 m. The corresponding elevation is therefore close to 3.5°.
It means that the first measurement is performed by the RADAR when the wake vortices are in vicinity of the center of the two upper beams whose elevations are 4° and 3.5°.
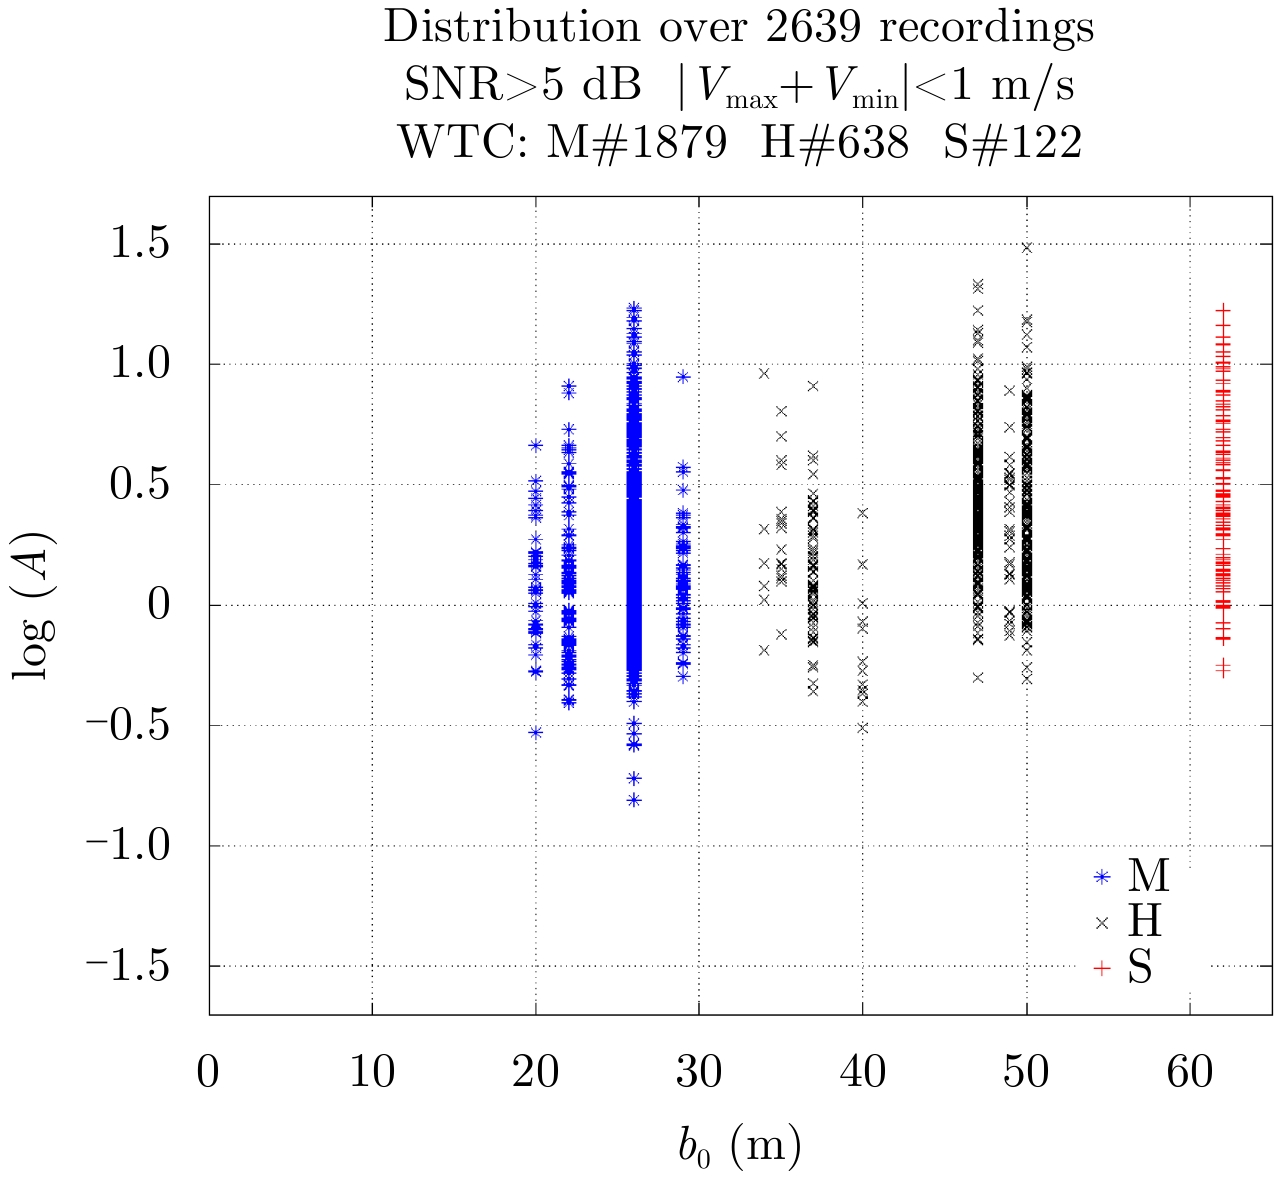
|
Fig.23 Coefficient a versus b0 (all categories)-Threshold 27R |
In that case:
• The first circulation of each core is then calculated as following:
| ${\Gamma _{\rm L}} = {\Gamma _{\rm R}} = {\Gamma _0} = \frac{{g \cdot M}}{{\rho \cdot U \cdot \displaystyle\frac{{{π}}}{4} \cdot b}}$ | (12) |
• The coefficients AL and AR are approximately equal (the cores L and R are supposed identical) and depend only on b0 the distance between the two cores:
| ${b_0} = \frac{{{π}}}{4} \cdot b$ | (13) |
The common value is denoted A(b0) in following.
The theoretical value of the maximum and of the minimum Doppler velocity calculated at the center of RADAR beams 4° and 3.5° are calculated as following:
| $\begin{align} {V_{{\rm{r(max)}}}} - {V_{{\rm{rain}}}} \approx & - \left( {{V_{{\rm{r(min)}}}} - {V_{{\rm{rain}}}}} \right) \\ \approx & \frac{{{\Gamma _0}}}{{2 \cdot {{π}} \cdot {b_0}}} \cdot A({b_0})\end{align}$ | (14) |
This theoretical value is compared to the maximum and to the minimum Doppler velocity calculated by the RADAR for all aircrafts landing at threshold 27R.
The simulation results presented in Subsection 3.2 predict that the coefficient A depends on b0, the distance between the two cores L and R. This is not confirmed by the Fig. 23 showing the coefficient log(A) (A is expressed in log scale) as a function of the theoretical distance b0 for all aircrafts landing at threshold 27R: the observed log(A) fluctuates randomly around 0 but is independent from the observed b0 varying from 20 m to 62 m.
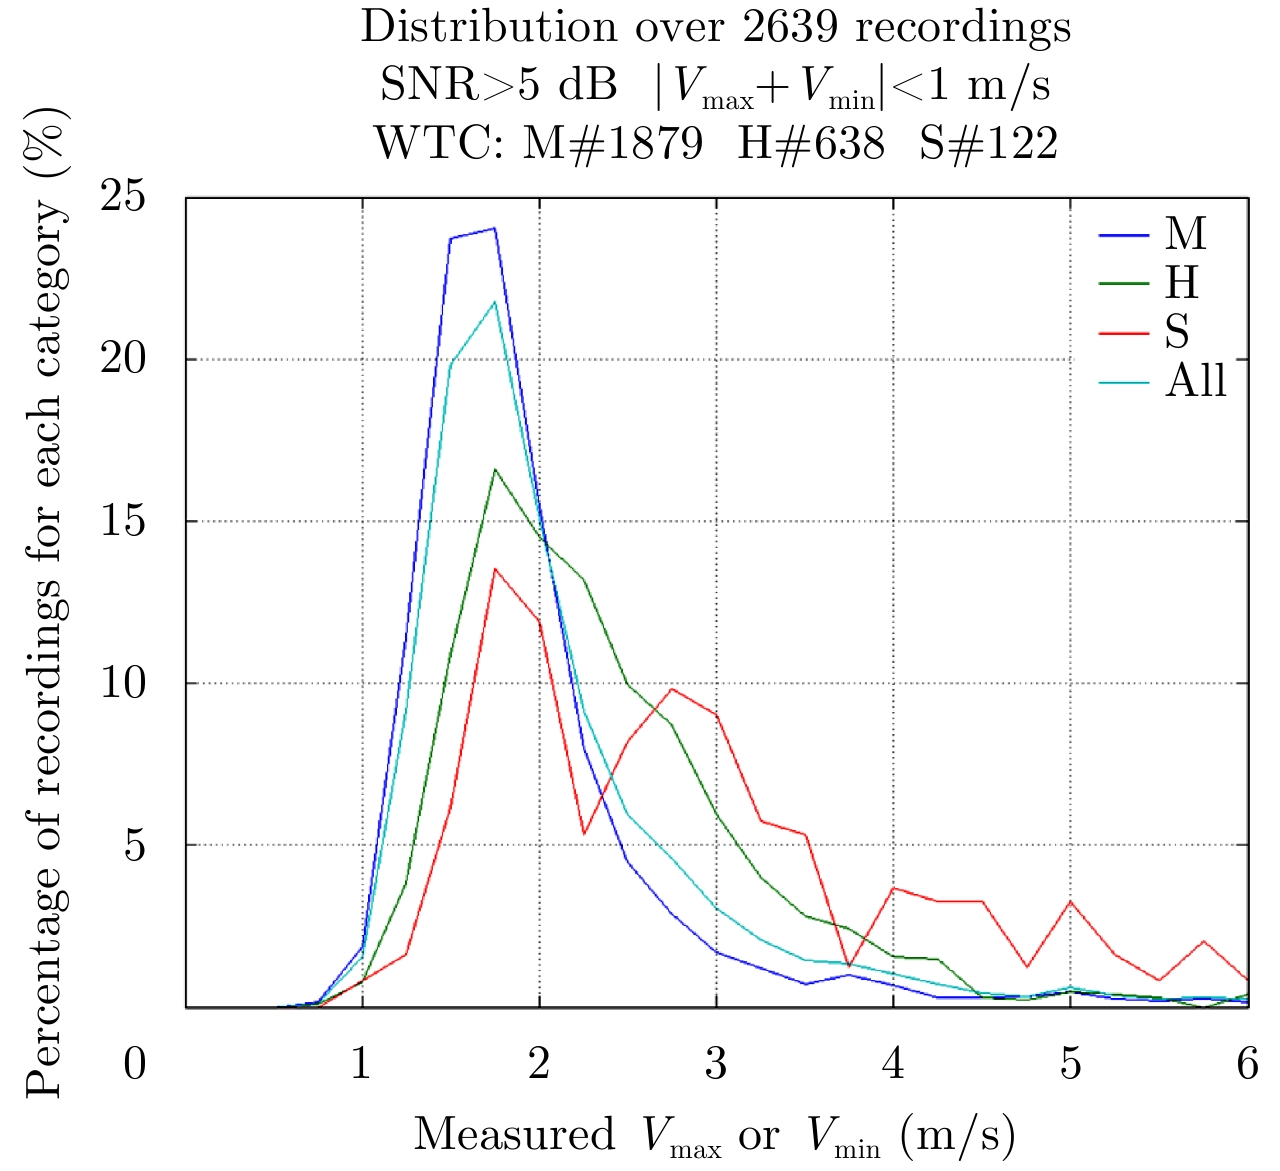
Here only the recordings having a difference |Vmax+Vmin| less than 1 m/s have been considered.
The histogram of measured Vmin and Vmax is given at Fig. 24 for aircrafts categories M, H and S and the statistical results (average, standard deviation, and mode) are summed up in following Tab. 4.
| Tab.4 Statistical results |
|
Fig.24 Histogram of measured Vmin & Vmax (all categories)-Threshold 27R |
The mode value (1.75 m/s) is independent from the category of aircraft and close to the theoretical value (1.60 m/s) expected for the landing aircraft observed during the data collection campaign.
The average value varies from 1.9 m/s to 2.9 m/s showing a tiny dependence to the aircraft category.
The standard deviation varies from 0.8 to 1.2 m/s for categories M, H and S. This high value is due to observation of very high values (ranging from 2.5 m/s to 5.0 m/s) compared to the mean value, each one having a small occurrence (less than 2%).
To conclude this paragraph:
• The maximum and the minimum of the Doppler velocity could be used to retrieve an estimation of the initial circulation
• The accuracy of the estimation of the initial circulation
o The simulations tools have to be refined and calibrated with on field measurements to better predict the behavior of the wake vortex.
o The first version uses the maximum and the minimum of the Doppler velocity to retrieve the circulation. The statistical analyses show that this attribute is too noisy to have an accuracy good enough to be used in operations. Following solutions needs to be explored to enhance the accuracy:
■ averaging of the maximum and minimum Doppler velocity estimator.
■ use of spectrum width as an estimator.
AcknowledgmentThe development and trials performed in Project 12.2.2 are funded under the European SESAR Program.
| [1] |
12.2.2, Preliminary System Requirements of Runway Wake Vortex Detection, Prediction and decision support tools, D1,00.01.00, 11/07/2010.
12.2.2, Preliminary System Requirements of Runway Wake Vortex Detection, Prediction and decision support tools, D1,00.01.00, 11/07/2010. (  0) 0)
|
| [2] |
12.2.2, Preliminary System Architecture of Runway Wake Vortex Detection, Prediction and Decision Support Tools, D2,00.01.00, 27/10/2010.
12.2.2, Preliminary System Architecture of Runway Wake Vortex Detection, Prediction and Decision Support Tools, D2,00.01.00, 27/10/2010. (  0) 0)
|
| [3] |
12.2.2, Recommendations on sensor technologies, D4,00.01.01, 14/10/2011.
12.2.2, Recommendations on sensor technologies, D4,00.01.01, 14/10/2011. (  0) 0)
|
| [4] |
Shariff K and Wray A. Analysis of the Radar reflectivity of aircraft vortex wakes[J].
Journal of Fluid Mechanics, 2002, 463(1): 121-161. ( 0) 0)
|
| [5] |
Liu Z X. Modélisation des signatures radar des tourbillons de sillage par temps de pluie[D]. [Ph.D. dissertation], 2013.
Liu Z X. Modélisation des signatures radar des tourbillons de sillage par temps de pluie[D]. [Ph.D. dissertation], 2013. (  0) 0)
|
| [6] |
Li J L, Wang X S, Wang T, et al.. Circulation retrieval of wake vortex under rainy condition with a vertically pointing radar[J].
IEEE Transactions on Aerospace and Electronic Systems, 2017, 53(4): 1893-1906. DOI:10.1109/TAES.2017.2675198 ( 0) 0)
|
| [7] |
Barbaresco F, Brion V and Jeannin N. Radar wake-vortices cross-section/Doppler signature characterisation based on simulation and field tests trials[J].
IET Radar, Sonar & Navigation, 2016, 10(1): 82-96. ( 0) 0)
|
| [8] |
Oude Nijhuis A C P, Thobois L P, Barbaresco F, et al.. Wind hazard and turbulence monitoring at airports with lidar and radar sensors and Mode-S downlinks: The UFO Project[J]. Bulletin of the American Meteorological Society. (in press)
Oude Nijhuis A C P, Thobois L P, Barbaresco F, et al.. Wind hazard and turbulence monitoring at airports with lidar and radar sensors and Mode-S downlinks: The UFO Project[J]. Bulletin of the American Meteorological Society. (in press) (  0) 0)
|
| [9] |
Kovalev D, Vanhoenacker-Janvier D, Wilson R, et al.. Electromagnetic wind radar simulator validation using meteorological data and a zenith X-band radar[C]. 2016 European Radar Conference (EuRAD 2016), London, 2016.
Kovalev D, Vanhoenacker-Janvier D, Wilson R, et al.. Electromagnetic wind radar simulator validation using meteorological data and a zenith X-band radar[C]. 2016 European Radar Conference (EuRAD 2016), London, 2016. (  0) 0)
|
| [10] |
Barbaresco F, Thobois L, Dolfi-Bouteyre A, et al.. Monitoring wind, turbulence and aircraft wake vortices by high resolution RADAR and LIDAR remote sensors in all weather conditions[Z]. Journées scientifiques URSI, 2015.
Barbaresco F, Thobois L, Dolfi-Bouteyre A, et al.. Monitoring wind, turbulence and aircraft wake vortices by high resolution RADAR and LIDAR remote sensors in all weather conditions[Z]. Journées scientifiques URSI, 2015. (  0) 0)
|
| [11] |
Barbaresco F, Jeantet A, and Meier U. Wake vortex detection & monitoring by X-band doppler radar: Paris orly radar campaign results[C]. Proceedings of IET International Conference on Radar Systems, Edinburgh, UK, 2007.
Barbaresco F, Jeantet A, and Meier U. Wake vortex detection & monitoring by X-band doppler radar: Paris orly radar campaign results[C]. Proceedings of IET International Conference on Radar Systems, Edinburgh, UK, 2007. (  0) 0)
|
| [12] |
Barbaresco F, Wasselin J P, Jeantet A, et al.. Wake vortex monitoring & profiling by Doppler X-band radar in all weather conditions[C]. Eurocontrol Innovative Research Workshop, Bretigny, 2007.
Barbaresco F, Wasselin J P, Jeantet A, et al.. Wake vortex monitoring & profiling by Doppler X-band radar in all weather conditions[C]. Eurocontrol Innovative Research Workshop, Bretigny, 2007. (  0) 0)
|
| [13] |
Barbaresco F, Wasselin J P, Jeantet A, et al.. Wake vortex profiling by Doppler X-band radar: Orly trials at initial take-off & ILS interception critical areas[C]. Proceedings of IEEE Radar Conference, Rome, 2008.
Barbaresco F, Wasselin J P, Jeantet A, et al.. Wake vortex profiling by Doppler X-band radar: Orly trials at initial take-off & ILS interception critical areas[C]. Proceedings of IEEE Radar Conference, Rome, 2008. (  0) 0)
|
| [14] |
Barbaresco F, Jeantet A, and Meier U. Wake vortex X-band radar monitoring: Paris-CDG airport 2008 campaign results & prospectives[C]. Proceedings of International Radar Conference-Surveillance for a Safer World, Bordeaux, France, 2009.
Barbaresco F, Jeantet A, and Meier U. Wake vortex X-band radar monitoring: Paris-CDG airport 2008 campaign results & prospectives[C]. Proceedings of International Radar Conference-Surveillance for a Safer World, Bordeaux, France, 2009. (  0) 0)
|
| [15] |
Barbaresco F and Meier U. Radar monitoring of a wake vortex: Electromagnetic reflection of wake turbulence in clear air[J].
Comptes Rendus Physique, 2010, 11(1): 54-67. DOI:10.1016/j.crhy.2010.01.001 ( 0) 0)
|
| [16] |
Barbaresco F. Airport radar monitoring of wake vortex in all weather conditions[C]. Proceedings of 2010 European Radar Conference (EuRAD), Paris, 2010: 85–88.
Barbaresco F. Airport radar monitoring of wake vortex in all weather conditions[C]. Proceedings of 2010 European Radar Conference (EuRAD), Paris, 2010: 85–88. (  0) 0)
|
| [17] |
Barbaresco F, Juge P, Klein M, et al.. Optimising runway throughput through wake vortex detection, prediction and decision support tools[C]. Proceedings of 2011 Tyrrhenian International Workshop on Digital Communications-Enhanced Surveillance of Aircraft and Vehicles (TIWDC/ESAV), Capri, Italy, 2011.
Barbaresco F, Juge P, Klein M, et al.. Optimising runway throughput through wake vortex detection, prediction and decision support tools[C]. Proceedings of 2011 Tyrrhenian International Workshop on Digital Communications-Enhanced Surveillance of Aircraft and Vehicles (TIWDC/ESAV), Capri, Italy, 2011. (  0) 0)
|
| [18] |
Barbaresco F, Juge P, Klein M, et al.. Wake vortex detection, prediction and decision support tools[C]. Proceedings of the 2013 IEEE/AIAA 32nd Digital Avionics Systems Conference (DASC), East Syracuse, NY, 2013: 6B1-1–6B1-15.
Barbaresco F, Juge P, Klein M, et al.. Wake vortex detection, prediction and decision support tools[C]. Proceedings of the 2013 IEEE/AIAA 32nd Digital Avionics Systems Conference (DASC), East Syracuse, NY, 2013: 6B1-1–6B1-15. (  0) 0)
|
| [19] |
Barbaresco F, Juge P, Klein M, et al.. Boom of airport capacity based on wake vortex hasards mitigation sensors and systems[C]. AUN2014: Airports in Urban Networks, Paris, 2014.
Barbaresco F, Juge P, Klein M, et al.. Boom of airport capacity based on wake vortex hasards mitigation sensors and systems[C]. AUN2014: Airports in Urban Networks, Paris, 2014. (  0) 0)
|
| [20] |
Barbaresco F, Juge P, Bruchec P, et al.. Eddy Dissipation Rate (EDR) retrieval with ultra-fast high range resolution electronic-scanning X-band airport radar: Results of European FP7 UFO toulouse airport trials[C]. Proceedings of 2015 European Radar Conference (EuRAD), Paris, 2015.
Barbaresco F, Juge P, Bruchec P, et al.. Eddy Dissipation Rate (EDR) retrieval with ultra-fast high range resolution electronic-scanning X-band airport radar: Results of European FP7 UFO toulouse airport trials[C]. Proceedings of 2015 European Radar Conference (EuRAD), Paris, 2015. (  0) 0)
|
| [21] |
Speiker L J P, Barbaresco F, Frech M, et al.. ATC-Wake: Integrated wake vortex safety & capacity system[J].
Journal of Air Traffic Control, 2007, 49(1): 17-32. ( 0) 0)
|
| [22] |
Winckelmans G, Desenfans O, Barbaresco F, et al.. The ATC-Wake Predictor system and its potential use to increase the capacity at airports[C]. International Symposium on Sensors and Systems for Airport Surveillance, Paris, France, 2005.
Winckelmans G, Desenfans O, Barbaresco F, et al.. The ATC-Wake Predictor system and its potential use to increase the capacity at airports[C]. International Symposium on Sensors and Systems for Airport Surveillance, Paris, France, 2005. (  0) 0)
|
| [23] |
Barbaresco F. Compréhension et maîtrise des tourbillons de sillage: Cinq siècles d’aventures de Léonard de Vinci à Jean Leray[Z]. Revue REE, 2013(3): 84–88.
Barbaresco F. Compréhension et maîtrise des tourbillons de sillage: Cinq siècles d’aventures de Léonard de Vinci à Jean Leray[Z]. Revue REE, 2013(3): 84–88. (  0) 0)
|
| [24] |
Barbaresco F. Airport radar monitoring of wake vortex in all weather conditions[C]. Proceedings of 2010 European Radar Conference (EuRAD), Paris, 2010.
Barbaresco F. Airport radar monitoring of wake vortex in all weather conditions[C]. Proceedings of 2010 European Radar Conference (EuRAD), Paris, 2010. (  0) 0)
|
| [25] |
Vanhoenacker-Janvier D, Djafri K, della Faille de Leverghem R, et al.. Simulation of the radar cross-section of wake vortices in clear air[C]. Proceedings of the Seventh European Conference on Radar in Meteorology and Hydrology, Toulouse, 2012.
Vanhoenacker-Janvier D, Djafri K, della Faille de Leverghem R, et al.. Simulation of the radar cross-section of wake vortices in clear air[C]. Proceedings of the Seventh European Conference on Radar in Meteorology and Hydrology, Toulouse, 2012. (  0) 0)
|
| [26] |
Barbaresco F, Juge P, Klein M, et al.. Wake vortex detection, prediction and decision support tools in SESAR program[C]. Proceedings of the 32th Digital Avionics Systems Conference (DASC), East Syracuse, NY, 2013.
Barbaresco F, Juge P, Klein M, et al.. Wake vortex detection, prediction and decision support tools in SESAR program[C]. Proceedings of the 32th Digital Avionics Systems Conference (DASC), East Syracuse, NY, 2013. (  0) 0)
|
| [27] |
Barbaresco F. Radar monitoring of wake vortex: Electromagnetic reflection of wake turbulence in clear air[Z]. CR Physique Académie des Sciences, Elsevier, 2010.
Barbaresco F. Radar monitoring of wake vortex: Electromagnetic reflection of wake turbulence in clear air[Z]. CR Physique Académie des Sciences, Elsevier, 2010. (  0) 0)
|
| [28] |
Liu Z, Jeannin N, Vincent F, et al.. Development of a radar simulator for monitoring wake vortices in rainy weather[C]. Proceedings of 2011 IEEE CIE International Conference on Radar (Radar), Chengdu, China, 2011.
Liu Z, Jeannin N, Vincent F, et al.. Development of a radar simulator for monitoring wake vortices in rainy weather[C]. Proceedings of 2011 IEEE CIE International Conference on Radar (Radar), Chengdu, China, 2011. (  0) 0)
|


